Categories
Technology Stocks

CrowdStrike Holdings to entrench itself by selling multiple modules over time with its platform-based approach

Business Strategy and Outlook

CrowdStrike is solidly growing its partner revenue stream, which can be critical to keeping the customer addition momentum. ARR from public cloud deployments was $106 million at the end of the fourth quarter, up 20% sequentially. AWS marketplace ARR grew over 100% year over year and CrowdStrike’s MSSP ARR grew by over 200% year over year. While it is withholding these large growth numbers to moderate with scale, it is seen ample growth opportunities as organizations migrate away from legacy endpoint providers and look to managed service partner offerings for protection. Additionally, it is alleged that CrowdStrike’s leading professional services organization is a powerful lead generator. For every $1 spent on professional services, such as resolving organization’s breaches, the company subsequently generates $5.71 in security subscription ARR, up from $5.51 the year prior.

Guidance for the first quarter includes 53% year-over-year sales growth and adjusted earnings of $0.22-$0.24. For fiscal 2023, CrowdStrike is targeting 48% annual revenue growth and adjusted earnings of $1.03-$1.13. It is anticipated that CrowdStrike can overachieve these guideposts behind the strong momentum in core endpoint and adjacent areas, an increased reach due to partner success, and a heightened threat environment creating a powerful demand for upgraded cybersecurity posture.

Analysts have been raising their fair value estimate for narrow-moat CrowdStrike Holdings to $225 per share from $200 after its fourth-quarter results topped analysts lofty revenue growth and earnings expectations, and the company provided robust fiscal 2023 guidance. Even with CrowdStrike shares soaring by 14% in after-hours trading to $193, which is still seen as marginal upside for investors. The increase is spurred from expecting higher growth alongside margin expansion as it is likely for CrowdStrike to gain in an outsize manner from various trends. It is held, CrowdStrike will continue landing customers at a rapid rate as organizations move away from legacy endpoint protection solutions, and then further entrench itself by selling multiple modules over time with its platform-based approach. The company also benefits from a heightened threat environment with a larger attack surface brought up by remote work and organizations using more cloud-based resources, a skills gap within cybersecurity driving demand for CrowdStrike’s managed security, and its professional services being called upon for breach remediation assistance.

Financial Strength

Fourth-quarter sales growth of 63% year over year came from subscriptions increasing by 66% and professional services expanding by 26%. Annualized recurring revenue expanded 65% to $1.73 billion and remaining performance obligations grew 67% to $2.27 billion, both year over year. It is anticipated these robust results show CrowdStrike’s leadership in its core endpoint protection, growth in adjacent areas like IT hygiene and log ingestion, and momentum with partners. CrowdStrike ended the quarter with 16,325 customers, up 65% year over year. Alongside rapid client additions, experts positively view the company being able to keep world-class retention metrics, with dollar based net retention of 124% and gross retention of 98%. Customers buying at least 4 and 6 subscriptions were 69% and 34%, respectively, which is meant to show organizations consolidating spending toward CrowdStrike’s platform

Company Profile

CrowdStrike Holdings provides cybersecurity products and services aimed at protecting organizations from cyberthreats. It offers cloud-delivered protection across endpoints, cloud workloads, identity and data, and threat intelligence, managed security services, IT operations management, threat hunting, identity protection, and log management. CrowdStrike went public in 2019 and serves customers worldwide.

(Source: MorningStar)

General Advice Warning

Any advice/ information provided is general in nature only and does not take into account the personal financial situation, objectives or needs of any particular person.

Categories
Technology Stocks

Xero Ltd : Many technology stocks have been caught in an asset price bubble linked to interest rates

Business Strategy and Outlook

The relationship between Xero’s market valuation and interest rates isn’t simple or linear, but it is held it’s been strong in recent years. For example, between early 2017 and late 2020, Xero’s one-year forward enterprise value to revenue multiple increased to 26 from 6 without an equivalent increase in its revenue growth outlook, in experts opinion. During this period, the 10-year Australian government bond yield fell to around 1% from around 3%. It is likely falling interest rates encouraged investors to increase their valuations for Xero, which was a catalyst for self-feeding share price momentum and relative valuation based upward re-valuations. But, if anything, Xero’s reported revenue has been weaker than it is anticipated in recent years. For example, Xero’s fiscal 2021 revenue was 9% below the forecast experts made in 2017.

Although it is well attributed the technology stock rally between early 2020 and late 2021 to interest rate falls, many investors and much of the media attributed it to a permanent increase in demand for information technology products and services, triggered by the coronavirus pandemic. However, the realization that many technology stocks have been caught in an asset price bubble linked to interest rates, rather than driven higher by sustainable earnings growth, appears to be occurring, and previously “hot” stocks are experiencing severe share price falls.

However, it is agreed the world has changed over the past four years, and the notion of competition within a global cloud-based software as a service market has evolved to recognize that the market isn’t bound by national borders in the same way as it used to be. Another other option for Intuit would be to acquire Xero but divest businesses in regions where regulatory obstacles exist. This could mean at least acquiring Xero’s U.K. business, which would still strengthen its existing business in an important geography and arguably leave far less viable competitors in other regions.

Financial Strength

At this stage, it is considered an acquisition of Xero by Intuit to be unlikely for several reasons. Unlike United Kingdom based Sage Group’s acquisition-led growth, Intuit has expanded its software organically globally. An acquisition of Xero would create a second platform and brand for Intuit which is uncertain, the company would want to maintain over the long term. Migrating Xero’s customers onto Intuit branded products would also be challenging. However, despite these challenges, an acquisition of Xero by Intuit isn’t completely out of the question. Although Xero’s one-year forward enterprise value to revenue ratio of 12 is still higher than Intuit’s at 10, the premium has fallen significantly to just 23% currently from 139% in December 2020. A continuation of this trend could make Xero attractive, particularly as the firm offers arguably higher revenue growth than Intuit, significant cost synergies, a good global geographical fit, and the removal of Intuit’s main global competitor. The recent increase in interest rates has been swift, with the one-year Australian government bond yield increasing to 0.81% from 0.01% since September 2021, and the 10- year Australian government bond yield increasing to 2.5% from 1.2% over the same period. Experts agree that these trends have been the main cause of the reversal in the technology stock bull market, which began in March 2020. Since November 2021, the S&P/ASX All Technology index is down 29% and the Nasdaq Composite index is down 22%. Concerningly high inflation data is also increasingly indicating that interest rates may have further to rise

Company Profile 

Xero is a provider of cloud-based accounting software, primarily aimed at the small and medium enterprise, or SME, and accounting practice markets. The company has grown quickly from its base in New Zealand and surpassed local incumbent providers MYOB and Reckon to become the largest SME accounting SaaS provider in the region. Xero is also growing internationally, with a focus on the United Kingdom and the United States. The company has a history of losses and equity capital raisings, as it has prioritised customer growth.

(Source: MorningStar)

General Advice Warning

Any advice/ information provided is general in nature only and does not take into account the personal financial situation, objectives or needs of any particular person.

Categories
Global stocks Shares

FedEx Ground Margins Grappling With Wage/Cost Inflation, but Improvement Still Likely

Business Strategy and Outlook

Overnight delivery pioneer FedEx is one of three large national carriers that dominate the for-hire small-parcel delivery landscape–FedEx and UPS are the major U.S. incumbents, while DHL Express leads Europe. Rival UPS has been around much longer in the U.S. ground market, forging a density advantage and higher margins, but FedEx has gradually enhanced its ground positioning over the past decade, with help from its speed advantage over UPS and capacity investment.

Leading up to the pandemic, ground margins were grappling with heavy network investment, the gradual mix shift to lower-margin B2C deliveries, lost Amazon revenue, and a pullback in B2B shipments. That said, the pandemic driven e-commerce shift and related surge in residential package delivery demand, coupled with a massive uptick in parcel carriers’ pricing power drove a resurgence in FedEx’ profitability. Recovering B2B activity has also played a material role. Material labor constraints emerged in recent quarters, setting margins back . Therefore, Morningstar analysts assuming management will be able to mitigate some of these headwinds with increased productivity, and ground margins should see some recovery in the quarters ahead.

In general, FedEx’ extensive international shipping network is extraordinarily difficult to duplicate and domestic/international e-commerce tailwinds should remain favorable for years to come (outside a major recession). Despite Amazon insourcing more of its own U.S. last-mile package deliveries, FedEx continues to bolster its ground and express capabilities and is well positioned to serve the myriad other retail shippers pursuing e-commerce, not to mention its entrenched relationships in B2B delivery. The TNT integration has made headway, and expects efforts to bear more fruit in Europe as FedEx finalizes the integration by May 2022.

Financial Strength

Total debt approached $21 billion as of fiscal year-end 2021 (ended May), down slightly from $22 billion in fiscal 2020. Since May 2017, FedEx has borrowed around $7 billion (net) to finance aircraft purchases, sorting facility expansion and automation, pension funding, dividends, and periodic share repurchases. This partly reflects $3 billion of unsecured debt issued in April 2020 to increase financial flexibility as the pandemic hit, and to pay off part of its commercial paper program. FedEx ended fiscal 2021 with $7 billion in cash and equivalents, up from $5 billion. Total debt/adjusted EBITDA came in near 2 times in fiscal 2021, which represents improvement from 3.3 times in fiscal 2020, as the operating backdrop improved significantly. We expect that metric to hold relatively steady in fiscal 2022. Adjusted EBITDA excludes mark-to-market pension charges and nonrecurring costs.

Bull Says

  • Outside a prolonged recession, FedEx’s U.S. ground package delivery operations should continue to enjoy robust growth tailwinds rooted in favorable ecommerce trends.
  • FedEx’s massive package sortation footprint, immense air and delivery fleet, and global operations knit together a presence that’s extraordinarily difficult to replicate.
  • During its nearly five-decade history, FedEx has weathered multiple economic cycles. While short term results may suffer, the firm’s powerful parcel delivery network is firmly established.

Company Profile

FedEx pioneered overnight delivery in 1973 and remains the world’s largest express package provider. In its fiscal 2020 (ended May 2020), FedEx derived 51% of revenue from its express division, 33% from ground, and 10% from freight, its asset-based less-than-truckload shipping segment. The remainder comes from other services, including FedEx Office, which provides document production/shipping, and FedEx Logistics, which provides global forwarding. FedEx acquired Dutch parcel delivery firm TNT Express in 2016. TNT was previously the fourth-largest global parcel delivery provider.

 (Source: Morningstar)

General Advice Warning

Any advice/ information provided is general in nature only and does not take into account the personal financial situation, objectives or needs of any particular person.

Categories
ETFs ETFs

HACK aims to track the performance of an index that provides exposure to the leading companies in the global cybersecurity sector.

Approach

The index tracks the performance of the exchange-listed equity securities of companies across the globe that (i) engage in providing cyber defence applications or services as a vital component of its overall business or (ii) provide hardware or software for cyber defence activities as a vital component of its overall business. The fund invests at least 80% of its total assets in the component securities of the index and in ADRs and GDRs based on the component securities in the index.

Portfolio

An ETF Model Portfolio is a carefully selected portfolio of exchange traded funds (ETFs) and other exchange traded products constructed and managed by a professional investment manager.

The investment manager typically also provides regular reporting on the portfolio’s performance, along with ongoing communication on changes to the portfolios, the rationale for doing so, and broader commentary on the micro and macro environment.

BetaShares offers four series of model portfolios, each of which seeks to achieve capital growth and income streams through a careful blending of asset classes, including Australian and international equities, bonds, cash and commodities. The models are constructed using ETFs and other exchange-traded products, resulting in institutional-quality portfolios that are cost-effective, highly diversified, transparent, and simple to explain to clients.

  • Strategic asset allocation (SAA) ETF model portfolios: Built using forward-looking 10-year expected returns and risk for a diversified range of major asset classes.
  • Dynamic asset allocation (DAA) ETF model portfolios: Utilise return/risk parameters from SAA, rebalanced quarterly based upon BetaShares’ modelling of asset class misevaluations, risk objectives and economic considerations.
  • Dynamic Income model portfolios: Aim to produce total returns that are similar to the dynamic ETF models, but are weighted towards income rather than capital growth.
  • Pension Risk-Managed Model Portfolios: Uses ETPs that aim to provide enhanced income returns and/or less volatile returns through a systematic risk-management overlay.

People

dam O’Connor is a member of the BetaShares Distribution team responsible for supporting Institutional and Intermediary Broker and Adviser channels. Prior to joining BetaShares, Adam worked in stockbroking and advisory with Bell Potter Securities. Alex is responsible for leading the strategy and overall management of the business. Prior to co-founding BetaShares, Alex was closely involved in the establishment and development of several leading Australian financial services businesses including Pengana Capital and Centric Wealth. Alistair is a member of the BetaShares Distribution team, responsible for supporting Institutional and Intermediary Broker channels, as well as supporting the firm’s capital markets activities. Annabelle is a member of the BetaShares marketing team focusing on social media and content. Anthony is responsible for supporting the investment and operations functions at BetaShares. Anton is BetaShares’ internal legal adviser and is also responsible for managing the compliance function.  Ben is responsible for supporting the distribution of BetaShares funds to advisers across the Victoria and South Australia regions. Benjamin is a member of the BetaShares Distribution team, responsible for assisting with client inquiries.

Brendan is responsible for growing and servicing BetaShares Adviser business clients across Western Australia. In this role, Brendan is focused on educating advisers about the role and benefits of ETF’s and SMA’s in client portfolios and sharing updates on the expanding range of strategies available across the BetaShares product suite. Cameron’s responsibilities span supporting all distribution channels and working alongside the portfolio management team. Prior to joining BetaShares, Cameron was a portfolio manager at Macquarie Asset Management, and was responsible for the structuring and management of Macquarie’s listed and unlisted structured product offering. Cameron’s other experience includes Head of Product at Bell Potter Capital, working on JP Morgan’s Equity Derivatives desk and at Deloitte Consulting.

Performance 

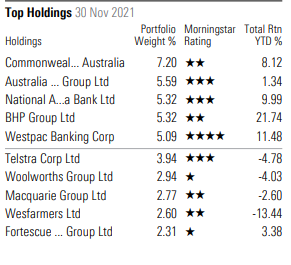
The ETFMG Prime Cyber Security ETF was the first ETF to focus on the cyber security industry. It tracks an index of companies involved in hardware, software and services, classifying the underlying stocks as either infrastructure or service providers. Top holdings include Cisco Systems, Akamai and Qualys.

About Fund

FactSet ETF Analytics Scoring Methodology is one of the first wide-ranging and robust methodologies for evaluating, comparing and contrasting exchange-traded funds. The researchers and analysts at FactSet developed the system. The result of thousands of hours of research, debate and testing, FactSet ETF Analytics Scoring Methodology provides a comprehensive structure for investors to analyze ETFs. FactSet’s quantitative system allows an investor to evaluate a fund at a glance, aggregating a sweeping range of detailed, often-difficult-to-obtain data points. FactSet’s Letter Grade combines the Efficiency and Tradability score evaluating costs to the investor. The combined score is assigned a letter grade (A-F) providing an institutional-caliber view on how well run and how liquid the ETF is. Efficiency includes risks, which are potential costs. Funds that minimize these risks can be more efficient.

(Source: Betashare)

DISCLAIMER for General Advice: (This document is for general advice only).

This document is provided by Laverne Securities Pty Ltd T/as Laverne Investing. Laverne Securities Pty Ltd, CAR 001269781 of Laverne Capital Pty Ltd AFSL No. 482937.

The material in this document may contain general advice or recommendations which, while believed to be accurate at the time of publication, are not appropriate for all persons or accounts. This document does not purport to contain all the information that a prospective investor may require.  The material contained in this document does not take into consideration an investor’s objectives, financial situation or needs. Before acting on the advice, investors should consider the appropriateness of the advice, having regard to the investor’s objectives, financial situation, and needs. The material contained in this document is for sales purposes. The material contained in this document is for information purposes only and is not an offer, solicitation or recommendation with respect to the subscription for, purchase or sale of securities or financial products and neither or anything in it shall form the basis of any contract or commitment. This document should not be regarded by recipients as a substitute for the exercise of their own judgment and recipients should seek independent advice.

The material in this document has been obtained from sources believed to be true but neither Laverne and Banyan Tree nor its associates make any recommendation or warranty concerning the accuracy or reliability or completeness of the information or the performance of the companies referred to in this document. Past performance is not indicative of future performance. Any opinions and or recommendations expressed in this material are subject to change without notice and, Laverne and Banyan Tree are not under any obligation to update or keep current the information contained herein. References made to third parties are based on information believed to be reliable but are not guaranteed as being accurate.

Laverne and Banyan Tree and its respective officers may have an interest in the securities or derivatives of any entities referred to in this material. Laverne and Banyan Tree do and seek to do business with companies that are the subject of its research reports. The analyst(s) hereby certify that all the views expressed in this report accurately reflect their personal views about the subject investment theme and/or company securities.

Although every attempt has been made to verify the accuracy of the information contained in the document, liability for any errors or omissions (except any statutory liability which cannot be excluded) is specifically excluded by Laverne and Banyan Tree, its associates, officers, directors, employees, and agents.  Except for any liability which cannot be excluded, Laverne and Banyan Tree, its directors, employees and agents accept no liability or responsibility for any loss or damage of any kind, direct or indirect, arising out of the use of all or any part of this material.  Recipients of this document agree in advance that Laverne and Banyan Tree are not liable to recipients in any matters whatsoever otherwise; recipients should disregard, destroy or delete this document. All information is correct at the time of publication. Laverne and Banyan Tree do not guarantee reliability and accuracy of the material contained in this document and are not liable for any unintentional errors in the document.

The securities of any company(ies) mentioned in this document may not be eligible for sale in all jurisdictions or to all categories of investors. This document is provided to the recipient only and is not to be distributed to third parties without the prior consent of Laverne and Banyan Tree.

Categories
Funds Funds

Realindex Australian Share-Class A: A well versed, Economical Option with Good Background

Approach
Realindex uses a systematic index method employing four equally weighted measures of a company’s economic size to rank and weight stocks in the portfolio. These criteria are adjusted sales, cash flow, and dividends and latest available adjusted book value. Additional earnings quality, near-term value, and debtcoverage filters act to reduce exposure to stocks with greater uncertainty. A signal was also introduced in November 2015 that downweights stocks with negative momentum and overweights stocks with positive momentum. As a part of its endeavor to improve current metrics, Realindex has more recently refined the book value metric to factor in intangibles as well by adjusting it with capitalize R&D and marketing expenses. The filters have contributed to a value bias and tilt to established companies that typically trade at a discount. This alternative approach to traditional index investing aims to eliminate the relationship between portfolio weighting and over/undervaluation associated with weighting a portfolio by market cap. The portfolio is rebalanced quarterly, resulting in average annual turnover of about 15%. The team handles all aspects of research, portfolio management, implementation, and execution with a focus on minimizing trading costs and market impact.


Portfolio
Realindex constructs a diversified, value-leaning portfolio. The strategy’s factors and price filters can lead to some differences relative to the more commonly used S&P/ASX 200 Accumulation Index. For example, the portfolio typically has lower price/book ratios and higher dividend yields. Realindex’s absolute weighting to most sectors remains relatively stable because the fundamental size characteristics tend not to fluctuate wildly unlike the sector weights fluctuation in market-cap benchmarks. Other deviations have been a historic tilt away from healthcare and real estate. Relative to the category index, S&P/ASX 200 Index, the strategy is value-focused and yield-oriented. Large-cap bias is apparent in the portfolio, but it is relative to the category average. As of November 2021, the portfolio was overweight in financial services and underweight in resources and healthcare. Realindex’s portfolio, traditionally, has remained quite similar to market-cap benchmarks overall. Historically, active share has hovered around 20%.

People
Realindex has been through a significant phase of transition in the past couple of years bought about by the end of the partnership with RAFI and the exit of a few senior portfolio managers. This has provided an opportunity for Realindex to revamp its overall team structure and bring on experienced investment professionals. The experienced David Walsh has joined as the head of investment, leading portfolio management and research, which Scott Hamilton leads. With the hires of Joana Nash and Ron Guido as experienced senior quant portfolio managers, Realindex has also beefed up its quant research capabilities.
The team is nimbler now for prioritization and effective collaboration on research initiatives and efficient implementation of the research outcomes, although it is preferred to have clearer lines between the research and portfolio management teams. The visible progress made in the trailing 18 months in research projects (for example, ESG factor impact on price and incorporating intangibles into the book value) augmenting the investment process through the implementation of novel signals is testimony of the team’s collective ability. The recent departure of experienced senior portfolio manager Raelene De Souza is unfortunate. Historically, Realindex has been successful in attracting top investment talent. But the length of their association with the firm has been shorter than it is prefered.


Performance
Realindex Australian Shares has delivered impressive peer-relative performance from inception through February 2022. Its five-year return of 8.5% per year as of February 2022 has easily outpaced the category average but only matched the broader market’s index return, indicating the tough environment it has been for value managers. This performance is principally attributed to the overweighting in materials, underweighting in healthcare, and energy. Better stock inclusion from the resources and consumer cyclical sectors has been additive too. Specifically, overweightings in BHP Group and Wesfarmers has added to performance and offset marginally by the overweighting in Westpac Banking. Amid the pandemic-induced uncertainties across the market, the strategy was admirably more resilient than the average category manager. The impressive outperformance was largely fueled by the strategy’s overweighting in materials, consumer cyclical, and consumer staples (a recurring theme across short- and long-term performance), although slightly offset by its overweighting in financial services. Over the trailing year through February 2022, the strategy has outperformed the S&P/ASX 200 Index but marginally stayed below the category average as value stocks have staged a reversal.

About Fund:
Realindex forms a universe of Australian companies based on accounting measures.Factors such as quality, near – term value and momentum are applied to form a final portfolio of companies. The resulting portfolio has a value tilt relative to the benchmark and provides the benefits of being lower in cost, lower turnover and highly diversified compared to traditional active investment strategies. Realindex overhauled its investment team with an aim to create a nimbler team structure and has hired investment professionals with a high skillset and experience level. The new team has made real progress in the trailing 18 months defining the research agenda and prioritizing projects in terms of their potential to value add. These developments paint a positive picture for the strategy; however, investors should note that the team’s tenure is short and Realindex’s track record in team turnover has not been impressive. As such, it is alleged for the investment team to exhibit longevity before experts’ conviction level is strengthened.

(Source: Morningstar)
General Advice Warning
Any advice/ information provided is general in nature only and does not take into account the personal financial situation, objectives or needs of any particular person.

Categories
Fixed Income Fixed Income

Cheap passive exposure to Australian fixed income

Approach

This strategy aims to track the Bloomberg Ausbond Composite 0+ Index with a tracking error of 0.05% per year or less (before fees). IShares is typically able to achieve full replication of the government-bond component in the portfolio because of ample liquidity and breadth. To alleviate liquidity challenges, the firm uses stratified sampling to acquire corporate and supranational exposures–an industry-standard approach, but one in which iShares excels thanks to its sophisticated global trading systems and experienced team. When the team can’t buy all the bonds in the index at a reasonable price, it will instead buy a basket of bonds that has similar credit and duration risks within allowable tolerance ranges. The team also employs strategies like securities lending to generate additional returns, helping to offset the performance drag from factors like fees and trading costs. IShares’ scale further minimises trading costs; a large active book and the firm’s ETF business allow for cross-trades and wide broker access. IShares thus executes trades cheaply, which is crucial in index fund management. It’s worth noting that Bloomberg’s index assumes distributions earn no interest, whereas iShares may accrue interest on its distribution cash balances. This may cause some tracking error, but ultimately it is a positive tailwind.

Portfolio

This strategy aims to fully replicate the Bloomberg AusBond Composite 0+ Index. Factoring cost, liquidity, and existing diversification if it doesn’t make sense to own all the bonds on issue, it will use stratified sampling to buy a basket of bonds with similar credit and duration risks. As of 28 Feb 2022, the index was composed of government and semigovernment bonds (85%), supranationals (5%), and corporate bonds (9%). The fund invests in high-quality bonds, with AAA rated debt constituting 71% of the benchmark’s quality exposure. Banks and other financials issue most of the credit in the index. The fund’s duration continues to increase with the benchmark as yields mostly hovered around historic lows barring the recent spike, up from 4.95 years at October 2016 to 5.8 years at 28 Feb 2022. The lengthening duration is a result of Commonwealth Government Bonds being issued at longer tenures, such as 30 years. But it means the fund faces the risk of rising yields globally, when we would expect active managers in this space to outperform their long-duration passive peers. Overall credit quality and appropriate diversification make this strategy an appropriate core exposure.

Performance: In terms of Annualised and Cumulative basis

Top 10 Holdings of the fund

About the fund

The fund aims to provide investors with the performance of the Bloomberg Aus Bond Composite 0+ Yr Index SM, before fees and expenses. The index is designed to measure the performance of the Australian bond market and includes investment grade fixed income securities issued by the Australian Treasury, Australian semi-government entities, supranational and sovereign entities and corporate entities.

(Source: Morningstar)

General Advice Warning

Any advice/ information provided is general in nature only and does not take into account the personal financial situation, objectives or needs of any particular person.

Categories
Dividend Stocks

Inghams Group – The Board declared a fully franked Dividend of 6.5 cps, in line with the pcp, and Equates to Payout Ratio of 60.9%

Investment Thesis:

  • Trading on undemanding multiples and below our valuation. 
  • Potential for an improvement in the pricing environment. 
  • Quality management team who has managed disruptions for the Covid-19 pandemic well. 
  • Quality assets and operates as Australia and New Zealand’s largest integrated poultry producer.
  • Project Accelerate has proven successful in driving automation and labour productivity, which supports earnings uplift despite decrease in revenue.  
  • Procurement initiatives implemented with benefits in line with expectation.
  • Investing to increase capacity and capability across the business in Australia and New Zealand plants.
  • Capital management initiatives are possible with a strong balance sheet.

Key Risks:

  • Re-negotiation of key contracts with large customers on unfavourable terms. 
  • Increase in feed and electricity costs, which may be pushed to customers through market price increases, reducing competitiveness. 
  • No news on the appointment of a new CEO creates uncertainty. 
  • Customer concentration risk in QSR (Quick Service Restaurants) and Supermarkets. 
  • Susceptible to exotic disease breakouts, impacting ING’s ability to supply poultry products. 
  • Significant reduction in volume and quality from parent stock supplier.
  • Material interruptions to ING’s complex and interlinked supply chain.

Key Highlights:

  • Group core poultry sales volumes grew +5.6%, driven by strong volume growth of +6.5% in Australia.
  • Statutory EBITDA of $220.4m, and Underlying EBITDA of $222.4m, was up +2.2% and +1.7%, respectively.
  • Statutory NPAT of $38.4m, up +8.8% and Underlying NPAT of $39.7m, up +5.9%
  • Cash flow from operations of $186.6m, was up +4.7%. Cash conversion ratio of 83.5% reflects seasonal working capital cycle and in-line with the pcp.
  • ING retained a solid balance sheet with net debt of $264.6m and leverage of 1.3x, a significant reduction from 1.7x in the pcp.
  • Total capital expenditure of $24.0m was lower than the pcp, reflecting completion of hatchery projects, ongoing project disruptions caused by Covid-19 lockdowns and delays in equipment being shipped.
  • The Board declared a fully franked dividend of 6.5 cps, in line with the pcp, and equates to payout ratio of 60.9% of Underlying NPAT post AASB 16 adjustments, which is at the lower end of ING’s 60 – 80% target range.
  • In Australia segment, Core poultry volumes grew +6.5% to 203.4kt, despite Covid-19 lockdowns and challenging market conditions. Revenue grew +1.9% driven by core poultry revenue growth of +2.2%, which grew despite weak pricing across the Wholesale channel due to excess supply, partially offset by feed revenue, declining -2.0% as customers transition supply away in preparation for closure of the ING’s WA Feedmill. Underlying EBITDA declined -0.3% to $185.1m, reflecting a lower Intercompany royalty charge, reduced by $3.2m.
  • In New Zealand segment, Core poultry volumes were flat at 33.7kt, as Covid-19 lockdowns were reintroduced. Core poultry revenue increased +3.6%, due to price increases applied across all channels to help offset higher feed costs and inflationary pressures related to supply chain disruption. Underlying EBITDA of $19.1m increased $3.3m versus the pcp, with the change to intercompany royalty charge accounting for $3.2m.

Company Description:

Inghams Group Ltd (ING) is Australia and New Zealand’s largest integrated poultry producer. The Company produces and sells chicken, turkey and stock feed that is used by the poultry, pig, dairy and equine industries. 

(Source: Banyantree)

General Advice Warning

Any advice/ information provided is general in nature only and does not take into account the personal financial situation, objectives or needs of any particular person.

Categories
Dividend Stocks

Amadeus and GDS relationships to be the exception rather than the rule

Business Strategy and Outlook

While Amadeus still stands to see material near-term corporate and European demand headwinds from the coronavirus and geopolitical conflict, it is aniticipated its leadership position in global distribution systems, or GDS, to endure during the next several years, driven by its leading network of airline content and travel agency customers as well as its healthy position in software solutions for these carriers and agents. Amadeus is the largest of the three GDS operators (narrow-moat Sabre is number two, followed by privately held Travelport) that control nearly 100% of market volume. 

Amadeus’ GDS enjoys a network effect (source of its narrow moat). As more supplier content (mostly airline content) is added, more travel agents use the platform; as more travel agents use the platform, suppliers offer more content. This network advantage is solidified by technology that integrates GDS content with back-office operations of agents and IT solutions of suppliers, leading to more accurate information that is also easier to book and service the end customer with. The 2016 acquisition of airline IT company Navitaire and 2018 acquisition of hotel IT company TravelClick expanded Amadeus’ GDS network advantage through new customer integration, as Navitaire focuses on low-cost carriers while the company’s existing Altea division focuses on full-service carriers, and TravelClick has a midscale lodging presence versus Amadeus’ legacy hotel offering, which focuses on enterprises. 

Replicating a GDS platform entails aggregating and connecting content from hundreds of airlines to a platform that is also connected to travel agents, requiring significant costs and time. Still, although it is viewed GDS advantages as substantial, technology architechtures like that of eTraveli (set to be acquired by narrow-moat Booking Holdings in early 2022), enable end users to access not only GDS content but supply from competing platforms, which could take some volume from GDS operators. Also, GDS faces some risk of larger carriers and agencies direct connecting, although it is likely these relationships to be the exception rather than the rule.

Financial Strength

While near-term industry travel demand remains below prepandemic marks, Amadeus’ balance sheet is clearer. Amadeus entered 2020 with just 1.4 times net debt/EBITDA, and it is projected it has enough liquidity for four years even at near zero demand levels. Amadeus has taken aggressive actions to shore up its liquidity profile. In March 2020, Amadeus began to cut costs and secured an additional EUR 1 billion one-year bridge loan, in addition to the undrawn EUR 1 billion revolver it already had. In April 2020, the company raised EUR 1.5 billion with a EUR 750 million equity offering (at a 5% discount to closing stock prices) and a EUR 750 million convertible note (at a strike price 40% above closing stock prices). In May 2020, Amadeus raised EUR 1 billion in debt at interest rates of 2.5%-2.9%. It is alleged banking partners to provide any additional needed funding, given Amadeus’ sizable network, switching costs, and efficient scale advantages that underpin its narrow moat.Net debt/EBITDA increased to 5.5 times in 2021, due to lower demand resulting from COVID-19, but it is foreseen a return to within management’s 1-1.5 times target range by 2023. Although about EUR 2.7 billion of the company’s EUR 4.3 billion in long-term debt matures over the next four years, its low leverage and stable transaction-based model in normal demand environments should not present any financial health concerns. It is projected Amadeus will generate EUR 7 billion in free cash flow (operating cash flow minus capital expenditures) during 2022-26.

Bulls Say’s

  • The company’s GDS network hosts content from most airlines and is used by many travel agents, resulting in significant industry share. Replicating this network would involve meaningful time and costs. 
  • The network advantage is supported by new products and technology that further integrate airlines and agents into its GDS platform. The company’s Navitaire, AirIT, and TravelClick acquisitions aid this expanding technology and integration reach. 
  • The business model is driven by transaction volume and not pricing, leading to lower cyclical volatility.

Company Profile 

Among the top three operators, Amadeus’ 40%-plus market share in air global distribution system bookings is the largest in the industry. The GDS segment represents 56% of total prepandemic revenue (2019). The company has a growing IT solutions division (44% of 2019 revenue) that addresses the airline, airport, rail, hotel, and business intelligence markets. Transaction fees, which are tied to volume and not price, account for the bulk of revenue and profits. 

(Source: MorningStar)

General Advice Warning

Any advice/ information provided is general in nature only and does not take into account the personal financial situation, objectives or needs of any particular person.

Categories
Dividend Stocks

Sun Life have to carefully weigh the capital required along with potential for disruption to its existing operations

Business Strategy and Outlook

Following the 2008-09 financial crisis, Sun Life made several positive changes to its business operations, most notably selling its lagging U.S. life insurance and annuities business. Sun Life’s medium-term objectives include underlying EPS growth of 8%-10%, underlying return on equity of 12%-14%, and a dividend payout rate of 40%-50%. Canada and the United States continue to have several demographic trends working in favor of insurers, especially with wealth- and asset-management businesses, as an aging population increasingly looks to manage its savings. However, areas of growth remain fiercely competitive, and life insurance will remain structurally difficult, making it hard for Sun Life to maintain any excess returns. Sun Life is also focused on expanding its operations in Asia, though it is skeptical of this initiative ultimately providing significant value, given the subpar returns on equity so far. 

It is also held for Sun Life to continue to invest in digital tools and apps. In 2018, Sun Life acquired Maxwell Health, a startup that offers a digital employee-benefits platform. On the distribution side, Sun Life is working to sell insurance through mobile banking apps in Asia. Sun Life has a “four-pillar” acquisition strategy in which any deal needs to meet at least one of the following: It must add scale, add capabilities, deliver lifetime return on equity with the firm’s medium-terms objective, or be accretive to earnings over a reasonable time frame. In asset management, it is alleged for more consolidation in the industry and expect Sun Life to participate. In 2019, it acquired real estate investment firm BentallGreenOak and in 2020 announced a majority stake in Crescent Capital and Infrared Capital Partners, both of which are alternative asset managers. While a large acquisition in the asset-management industry is possible, Sun Life would have to carefully weigh the capital required and the potential for disruption to its existing operations. In the insurance space, Sun Life swung big with its $2.5 billion acquisition of DentaQuest, which is expected to close midyear 2022.

Financial Strength

The life insurance business model typically entails significant leverage and potentially exposes the industry to outlier capital-market events and unanticipated actuarial changes. Sun Life was not immune to these risks and was hurt, like many of its peers, during the financial crisis. Since then, Sun Life has done a reasonably good job of reducing its debt by growing back its equity base while reducing absolute debt levels.As of Dec. 31, 2021, Sun Life has a total financial leverage ratio (the ratio of debt and preferred shares to total capital) of 25.5%, consistent with management’s long-term target of 25%. As of Dec. 31, 2020, Sun Life’s LICAT ratio was 145%. The Life Insurance Capital Adequacy Test is the sum of the available capital, surplus allowance, and eligible deposits divided by the firm’s base solvency buffer. Life Insurers in Canada must have a minimum of 90%, suggesting that Sun Life has an adequate buffer from a regulatory perspective.

Bulls Say’s

  • Over the next 20 years, the retirement-age population will grow to about one in five, significantly increasing the demand for financial-protection products. 
  • When interest rates rise, earnings for insurers like Sun Life should increase. 
  • Given its strong operating margins, Sun Life’s MFS asset-management franchise should drive earnings growth during an equity market recovery.

Company Profile 

Sun Life Financial is one of Canada’s Big Three life insurance companies along with Great-West Lifeco and Manulife. Sun Life provides insurance, retirement, and wealth-management services to individual and corporate customers in Canada, the United States, and Asia. It also owns MFS Investment Management, a Boston-based asset-management firm. Sun Life generates about a third of its profit from asset-management operations. 

(Source: MorningStar)

General Advice Warning

Any advice/ information provided is general in nature only and does not take into account the personal financial situation, objectives or needs of any particular person.

Categories
Global stocks Shares

We Expect Avery Dennison Will Enjoy Another Year of Strong Growth in 2022

Business Strategy and Outlook

 Avery Dennison is the largest supplier of pressure-sensitive adhesive materials and passive radio frequency identifiers in the world. Rising consumer packaged goods penetration in emerging markets should add to label growth, while growth in omnichannel retailing will aid RFID sales at Avery Dennison.

Avery sells pressure-sensitive materials to a highly fragmented customer base that converts specialty film rolls into labels for companies such as Kraft Heinz or Amazon. The concentrated market positions of Avery and competitor UPM Reflactac give each bargaining power over their customers. The labels and graphics materials, or LGM, and industrial and healthcare materials, or IHM, segments account for roughly 74% of company revenue. They convert paper, vinyl, and adhesives into composite films that become shipping labels, automotive graphics, and special-use tapes and films. While demand for these products is stagnant in developed markets, and expect Avery’s large emerging market footprint (around 40% of revenue for these segments) to drive mid-single-digit revenue growth.

 Avery’s Retail Branding and Information Systems segment, or RBIS, makes up 26% of sales and produces a mixture of apparel graphics, product tags, and passive radio frequency identifiers or RFID. While RFID accounts for around 25% of the segment’s revenue, it has grown rapidly in recent years and has increasingly become the focus of Avery’s RBIS segment. RFID products are typically integrated into product tags in industries which have both a diverse inventory and where UPC scanning is cumbersome or labour-intensive, such as apparel. Avery’s recent strategy shift to focus on reducing both costs and prices of the technology in order to gain share demonstrates the commoditized nature of these products. Even so, and think Avery will at least be able to grow with the market, or between 15% and 20% per year. The remainder of segment revenue comes from the application and production of apparel graphics and tags. It is expected expect revenue growth of these end uses to remain mixed, dependent largely on shifting fashion preferences.

Financial Strength

Avery Dennison is in very good financial health. The company ended 2021 with net debt/EBITDA of roughly 2.2, which gives the firm room to manoeuvre with regard to additional acquisitions, opportunistic share buybacks, or to boost its dividend. This remains just below management’s target range of 2.3-2.6, aimed at preserving its BBB credit rating. Avery’s target range of debt remains manageable, and shouldn’t become a material burden even if economic conditions worsen. Thanks to the amount of business Avery derives from consumer staples, cash flows usually remain relatively stable throughout the economic cycle.

Bulls Say’s

  • Emerging-market adoption of consumer-packaged goods will provide a long runway for sales growth. 
  • As RFID technology becomes widely adopted, Avery’s growth should receive a hefty tailwind. 
  • Avery’s dominance in retail branding information systems should lead to widening segment margins

Company Profile 

Avery Dennison manufactures pressure-sensitive materials, merchandise tags, and labels. The company also runs a specialty converting business that produces radio-frequency identification inlays and labels. Avery Dennison draws a significant amount of revenue from outside the United States, with international operations accounting for the majority of total sales.

(Source: MorningStar)

General Advice Warning

Any advice/ information provided is general in nature only and does not take into account the personal financial situation, objectives or needs of any particular person.