
Tag: Australian Market

The strategy’s research program is driven by teams from other asset classes or themes (Specialist Strategies, Portfolio Management, Equities, Fast Strategies and Core Strategies) who are responsible for their respective models (existing and new models). The portfolio managers of the AHL Alpha Program are Matthew Sargaison, Co-CEO of Man AHL and Russell Korgaonkar, CIO of Man AHL.
Investment Process
The Strategy invests in approximately 500 international markets across a range of sectors, utilizing instruments such as securities, futures, options, forward contracts, swaps, CFDs and other financial derivatives. The Strategy can also gain exposure to sectors via stocks, debt, bonds, currencies, short-term interest rates, energies, metals, credit and agriculture.
Historical low correlation to traditional assets classes such as equities and bonds
Given the focus on Diversification, capital is allocated using a quantitative and systematic methodology to maximise diversification and avoid investment style bais. This aims to deliver low correlation to traditional assets such as equities and bonds.
Solid Performance
Historically, the fund has delivered strong returns in equity market selloffs, albeit past performance is not an indicator of future performance, it is an indicator that the strategy has performed in the past. The fund delivered significant downside protection during market sell-offs – Covid – 19 market selloffs +5.8 per cent v/s S&P 500 Index -19.6 per cent v/s MSCI World -19.6 percent, fourth quarter in 2018 selloff +3 percent v/s S&P 500 Index -13.5 percent v/s MSCI World -12.9 percent, Eurpean debt crisis +5.3 percent v/s S&P 500 -13.8 percent v/s MSCI World -15.4 percent and GFC +25 percent v/s S&P 500 Index -49.2 percent v/s MSCI World -49.3 percent.
Downside Risks
- Significant turnover in the Broader Investment team.
- Investment strategy (trading systems) fails to yield alpha.
- Uses of derivatives and leverage adds additional risks and complexity.
Investment Approach

Fund Performance
Figure 1: Fund performance (as ofAug-21)–strategy has an absolute return target
| (%) | Fund (net) | ||
| 1-mths | +0.0% | ||
| Year-to-date (YTD) | +6.5% | ||
| 1-year | +10.4% | ||
| 3-year (p.a.) | +7.3% | ||
| 5-year (p.a.) | +4.3% | ||
| Inception (p.a.) | +5.2% | ||
| Annualised volatility | 8.8% |
Source: Man Group
About the Fund
The fund employs a systematic, statistically based investment strategy to exploit technical or price driven signals across a diverse range of global markets. The main strategy used in trend following i.e price trends (up or down) repeatable pattern ~ 500 international markets the fund can access. The portfolio invests in instruments such as Securities, Futures, Options, Forward contracts, Swaps, CFD and other derivatives, the strategy has an absolute return focus with target volatility of 10% p.a.
Company Profile
Man group is a global investment manager offering investors a diverse range of specialist active strategies and manages over US$135 billion globally. The company has headquarters in London but a globally network of offices. The company employs an extensive team of scientists, technologies and financial professionals.
General Advice Warning
Any advice/ information provided is general in nature only and does not take into account the personal financial situation, objectives or needs of any particular person.

that makes tactical asset allocation decisions between cash, duration, and higher yielding investments to produce returns in both rising and sliding bond yield environments.. The strategy aims to outperform the Benchmark in terms of net total return over rolling three-year periods by investing primarily in Australian fixed income securities.
Investment Philosophy + Process:
The Manager believes that taking a flexible approach to asset allocation allows the team to better manage fixed interest exposure and enhance returns depending on market.
The Fund’s investment and portfolio construction process consists of:
Stage 1: Strategy Formulation: The team ranks the active duration and credit positions of their core Australian Fixed Interest Income strategy.
Stage 2: Risk Calibration: Determine asset allocation using the ranking.
Stage 3: Implementation: Invest in range of cash, fixed interest and higher yielding securities, based on investments decisions from the following:
- Interest rates: (holding longer duration securities versus shorter-dated paper).
- Sectors: (government securities versus non-government given the risk premium).
- Securities: (given the underlying risk/reward, select appropriate non-government securities).
Portfolio Characteristics:
| Portfolio Characteristics | Details |
| Benchmark | 50% Bloomberg Composite 0 + 50% Bloomberg Bank Bill |
| Alpa target p.a.n.m (pree –fees) | 1.0% |
| Minimum suggested time frame | 3 years |
| Alpha source | 30% Rates + 30% Sector / Security selection + 40% Asset Allocation |
| Minimum weighted average credit quality | BBB |
(Source: Janus Henderson)
Investment team:
The Janus Henderson Australian fixed interest team, headed by Jay Sivapalan, is highly experienced and well resourced.
The environmental, social, and governance (ESG) factors are factored into the credit decision-making process. The Manager adheres to the “quality before price” attitude, and hence considers ESG factors to be critical in their four-pillar bottom-up credit analysis. The four pillars are as follows:
- Competitive Advantage and Industry Dynamics
- Financial Risk
- Management Profile
- ESG Risk
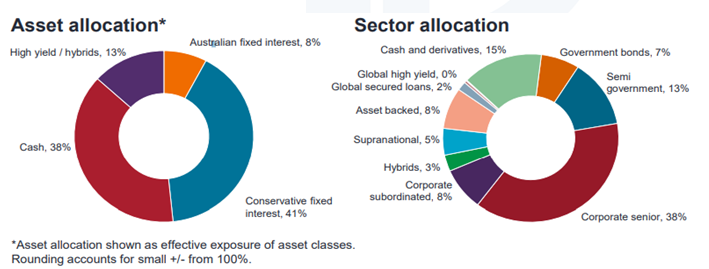
Asset and sector allocation:
(Source: Janus Henders)
Fund Performance(as of august2021:net) and current positioning:
| Percentage | Fund | Benchmark | Outperformance |
| 1-month | -0.09% | 0.05% | -0.14% |
| 3-month | 0.15% | 1.28% | -1.13% |
| 6-month | 0.74% | 2.11% | -1.37% |
| 1-year | 1.28% | 0.56% | +0.72% |
| 3-year (p.a.) | 2.60% | 2.68% | -0.08% |
| 5-year (p.a.) | 2.60% | 2.28% | +0.32% |
| Inception | 4.72% | 3.93% | +0.79% |
(Source: Janus Henderson)
Credit Process:

(Source: Janus Henderson)
Downside Risks:
- Investment strategy selection fails to yield alpha.
- Lead PM departsor significant turnover in the broader investment team
- Manager fails to make the right duration (short or long) call over an extended period of time.
- Credit and interest rate risk
Company Profile:
Janus Henderson is a worldwide asset management company with over 340 investment experts who specialise in all major asset types. Its individual, intermediary, and institutional clients come from all over the world and entrust it with over $500 billion in assets. Over the course of market cycles, Janus Henderson’s commitment to active management allows customers to outperform passive strategies. Its managers use their skills to analyse risk vs reward potential in times of both market calm and growing uncertainty, ensuring customers are on the right side of change.
General Advice Warning
Any advice/ information provided is general in nature only and does not take into account the personal financial situation, objectives or needs of any particular person.

the portion of return attributed to the S&P/ASX 20 Leaders Index, by 4% p.a. after fees on a rolling 3-year basis. The Fund invests primarily in Australian shares with high quality business models, strong growth, and underestimated earnings momentum and prospects.
Portfolio
This strategy looks very different from the S&P/ASX Small Ordinaries Index. First, it has traditionally held a significant stake in midsize and larger companies excluding the top 20.Bennelong believes it can capitalise on mispricing through superior fundamental research. The pronounced growth leaning also contributes to this vehicle’s differentiated look. It has traditionally led to an (unsurprising) aversion to the property trust, consumer staples, and utilities sectors. That said, A-REITs have featured on occasion, such as in mid-2019. Consumer discretionary, technology, and healthcare stocks are typically favoured, the attraction being both cyclical and structural growth. This is usually the source of the portfolio appearing expensive relative to the benchmark and peers. The search for growth can lead to mistakes; in such events, liquidity in small-cap names can reduce nimbleness for this strategy given its large asset base. The team is not averse to altering large positions quickly when its view on earnings growth changes. For instance, in early 2021, Bennelong cut the 10% allocation in Afterpay when business execution disappointed and competition increased. This fund is best used in a supporting player role. The firm manages around AUD 8.8 billion, including AUD 4.6 billion in this strategy as of 30 April 2021.
Performance
The long-term performance at Bennelong is strong. Given the strategy excludes the 20 largest Australian companies, the portfolio has a larger-cap feel than more-dedicated small-cap offerings. As a result, performance comparisons against its equity Australia mid/small-growth Morningstar Category peers should be undertaken cautiously. Bennelong outdid the index and most peers during 2015 and the first half of 2016 thanks to such positions as Domino’s and Aristocrat Leisure. The second half of 2016 was a stumble for Bennelong (and many peers), as resources and value stocks outperformed. The following two years saw it ride the highs of stocks like Treasury Wine Estates, Costa Group, and BWX only to abruptly see their share prices plummet contributing to middling years of performance. Mark East cut the first two names but held BWX as better fundamentals were expected. More recently, 2019 delivered average returns, as Corporate Travel Management detracted while Goodman Group added significant value as investors supported its industrial real estate exposure. However, longtime holdings in James Hardie, IDP Education, and Domino’s delivered in spades in 2020 as the market sought quality growth companies and the fund blazed past both the index and peers. Together with Fisher & Paykel healthcare, Bennelong has continued its outstanding run into the first half of 2021.


Source: Mornigstar
General Advice Warning
Any advice/ information provided is general in nature only and does not take into account the personal financial situation, objectives or needs of any particular person.

ESG screens and bottom-up fundamental analysis. The ESG philosophy is based on the view that sustainability and/or ethical screens improve the quality and robustness of the portfolio. This is because companies scoring high on Environmental, Social and Governance (ESG) dimensions will likely have lower systematic risks and regulatory risks from adverse ESG events. The Fund aims to exceed the benchmark returns (before fees and expenses) by 0.75% p.a. over rolling 3-year.
Opinion
- Well respected Fixed Interest team and experienced Portfolio Managers. The Pendal Income and Fixed Interest team is well resourced and led by the well-respected Vimal Gor, who is Head of Income and Fixed Interest at Pendal. The strategy is managed by Portfolio Manager George Bishay and Co-PM Timothy Hext, both with extensive experience in fixed interest markets. In terms of sustainable philosophy and screening processes, Edwina Matthew (Head of Responsible Investments) assists the team.
- Access to inhouse equity research team adds competitive advantage to bottom-up fundamental research on issuers. Bottom fundamental research on issuers and financial modelling to identify investment opportunities and avoiding deteriorating credits. Access to the Pendal Australian Equities team and CreditSights, a third-party global research house, are important components in the process
- Economic + Market + Technical models. The Manager feels their competitive edge comes from focusing on economic quant models, market quant models and technical models within a global context which help determine future direction of markets. These factors working in tandem and then the overlay ESG screens leads, in the manager’s view, a far superior portfolio composition
Investment Philosophy
Philosophy. The Fund’s core belief is that markets are inefficient, and that active management can improve risk and return. The ESG philosophy is based on the view that sustainability and/or ethical screens improve the quality and robustness of the portfolio. This is because companies scoring high on Environmental, Social and Governance (ESG) dimensions will likely have lower systematic risks and regulatory risks from adverse ESG events.
Portfolio Construction
The portfolio construction process is driven by the output from the macro input stage (top-down view on duration and yield curve), credit spreads and sector allocations (government vs credit, sector over/under weights within credit (defensive versus cyclical sectors). The portfolio construction process also gives considerations for correlation with existing securities, issuer/sector diversification, concentration, position sizing, liquidity, hedging, tracking error, and valuation.

General Advice Warning
Any advice/ information provided is general in nature only and does not take into account the personal financial situation, objectives or needs of any particular person.

Investment Thesis
We rate IVC as a Neutral for the following reasons:
- Trades in-line with our blended valuation (DCF / PE-multiple). IVC is currently trading on a 12-mth blended forward PE-multiple of 36.4x and 1.7% dividend yield.
- IVC continues to be impacted by Covid-19 and associated lockdown/containment measures.
- Potential for increased death rates.
- Continued cost control from strategic review and operational efficiency.
- IVC benefits from demographics and long-term population growth.
- IVC holds leading market positions in its core markets.
- IVC has strong cash flow conversion and generation.
- High barrier to entry with quality assets and business model that is difficult to replicate.
- Increased competition from budget operators in Australia.
Key Risks
We see the following key risks to our investment thesis:
- Continued reduction in death rate compared to expectations/forecasted trend.
- Increased competition especially around pricing.
- Protect and Grow 2020 does not yield incremental returns as anticipated.
- Underperformance of funds under management.
1H21 Results Highlights
Relative to the pcp:
- Statutory Revenue of $260.9m, up +13%.
- Operating Revenue of $257.3m, up +13%.
- Operating EBITDA of $63.6m, was up +31% with IVC returning to positive operating leverage.
- Operating EBIT of $39.4m, was up +46%.
- Reported Profit After Tax of $44m, compared to a Reported Loss After Tax of $18m in the pcp. Operating EPS of 14.4cps, was up +57%.
- IVC retained a strong balance sheet with cash of $131.2m and net debt of $124.7m. Capital management metrics improved with leverage ratio of 1.1x, strong cashflow conversion of 102% and ROCE of 10.4%, up 1.8 points on FY20.
- The Board declared an interim fully franked dividend of 9.5cps, up 73% over the pcp and equates to a dividend payout ratio of 66%, within IVC’s preferred dividend payout range.
Company Description
InvoCare Ltd (IVC) is the largest private funeral, cemetery and cremation operator in the Asia Pacific Region. It has leading market positions in countries like Australia, New Zealand, and Singapore.
General Advice Warning
Any advice/ information provided is general in nature only and does not take into account the personal financial situation, objectives or needs of any particular person.


Investment Thesis
- Based on our valuation, ANN’s share price trades at a >10% discount to our DCF valuation.
- ANN is a quality business with global manufacturing capabilities.
- We believe our 5-yr forward earnings estimates are on the conservative side and capture the moderating growth likely to be seen from the elevated levels experienced in FY21.
- FX translation should be positive for the Company.
- Raw material cost pressures can be shared with customers and suppliers.
- ANN has a strong balance sheet position with flexibility to return cash to shareholders or borrowing capacity for acquisitions
Key Risks
We see the following key risks to our investment thesis:
- Product recall.
- Trade wars escalate, leading to higher tariffs.
- Increase in competitive pressures.
- Adverse movements in AUD/USD.
- Emerging or developed market growth disappoints.
- Any worst or better prices for raw materials.
FY21 key trading metrics
- Sales of $2,027m, up +25.6% (+22.5% in CC) with Healthcare organic growth of +34.8% and Industrial organic growth of +7.1%.
- EBIT of $338m, up +56.0% (+51.4% in CC) with margin improving +330bps to 16.7%, driven by higher production volumes, pricing/mix benefit and SG&A operating leverage, partly offset by elevated labour and freight costs combined with increase in inventory provisions
- Profit Attributable to ANN shareholders of $246.7m, up +57.5% (+48.5% in CC) and EPS of 192.2cps (EPS would have been 193.9cps, without Cloud Computing accounting policy change), up +59.9% (+50.8% I CC).
- Operating Cash Flow of $49.2m (down -74.3% over pcp) representing cash conversion of 60.9%, negatively impacted due to greater investment in working capital to support top line growth along with pricing impact as well as higher capex to increase capacity in a number of higher demanded products. Capex increased +36.5% over pcp to $82.7m, however, remained below management’s $95-105m guidance due to temporary delays to shipments and installation as a result of COVID-19, with management expecting FY22 capex spend to be $80-100m.
- ROCE saw significant improvement (up +590bps to 19.8% pre-tax and up +550bps to 16.8% post tax), predominantly due to strong EBIT growth.
Company Description
Ansell Ltd (ANN) operates two global business units: (1) Ansell’s Industrial segment manufactures and markets multi-use protection solutions specific for hand, foot, and body protection, for a wide-range of industries such as automotive, chemical, metal fabrication; (2) Ansell’s Healthcare segment (Medical + Single Use) offers a full range of surgical and examination gloves covering all applications, as well as healthcare safety devices and active infection protection products. The segment also manufactures and markets single use hand protection. Ansell recently sold its sold its Sexual Wellness Global Business Unit group.
General Advice Warning
Any advice/ information provided is general in nature only and does not take into account the personal financial situation, objectives or needs of any particular person.

The process sets its universe by screening ASX-listed stocks with a market cap greater than USD 150 million. International companies incorporated outside of Australia are considered as well, provided they generate 50% of their revenue in Australia or have 50% of their total assets in Australia. For existing holdings, the market-cap limit is set at $75 million and the revenue threshold for offshore companies is established at 25%. To meet liquidity requirements, stocks must also have had at least USD 1 million daily trading average over three months and at least 250,000 shares traded per month. Stocks, which make up the top 90% of the investable universe, are equally weighted and capped at 10% at the time of quarterly rebalancing. VanEck has a deep global presence and uses robust daily portfolio monitoring systems and multi-levelled risk management to ensure trading is efficient and compliant.
Portfolio
The ETF mirrors the composition of the MVIS Australian A-REIT Index. The index consisted of 15 names as of July 2021. The portfolio holds a minimum of 10 stocks and excludes the smaller end of the cap spectrum, while mid-cap exposure is beefed up. Stocks that meet size and liquidity requirements are weighted by their free-float market capitalisation subject to a 10% weighting cap. While about a third held in the portfolio is directly invested in retail A-REITs, it has almost half of the allocation to diversified REITs. Sector exposures are significantly more consistent through time. A-REIT Index owing to limited stock changes in the top of the ASX/200 and the stock exposure limit of 10%. The portfolio is rebalanced every quarter; because of its exposure cap, turnover is typically 20%-40% .
| Sub- Industry Weightage | |
| Diversified REITS | 46.20% |
| Retail REITS | 28.00% |
| Office REITS | 11.90% |
| Industrial REITS | 10.70% |
| Specialized REITS | 3.20% |
| Other/Cash | 0.00% |
Source: MVA-Factsheet
Performance
MVA has closely matched the broader A-REIT market return while delivering standout performance against the category average from its inception through 31 July 2021. The ETF has annually outperformed the category average by 1.4% or 21% on a cumulative basis since inception.

Source: MVA-fact-sheet
Fundamentals
| No. of securities | 15 |
| Price/Earnings Ratio* | 10.66 |
| Price/Book Value Ratio* | 1.12 |
| Dividend Yield | 4.26 |
| Weighted Avg. Market Cap (M) | $12,362.00 |
Source: MVA-fact-sheet
People
The VanEck investment team is headed by Russel Chesler with Jamie Hannah as his deputy. Chesler is an industry veteran with over 25 years of experience across Sunstone Partners, Perpetual Limited, and Liberty Life. Hannah joined VanEck in 2014 from Source ETF where he was a part of the investment management team. The duo is supported well by two senior associates: Cameron McCormack and Alice Shen.
Price
The Net Asset Value of the fund (NAV) is $24.88 as on 31 August 2021 while the management cost is 0.35% p.a.n.m.
Top 10 Holdings of VanEck Australian Property ETF

Source: MVA-fact-sheet
About the fund
The VanEck Australian Property ETF incorporated on 14/10/2013 which invests in a diversified portfolio of ASX-listed securities with the aim of providing investment returns (before management costs) that closely track the returns of the MVIS Australia A-REITs Index.
The MVIS Australia A-REITs Index is a pure-play Australian sector index that aims to reflect the performance of Australia’s property sector.
The shares outstanding is 23,955,918 and the dividend is paid two times each in a year.
Individual Index components are chosen based on a strict rules-based system that prioritises liquidity, with a minimum of 10 holdings and a maximum weighting of 10% for each. . The underlying index sets itself apart from market-cap-weighted benchmarks with its sensible portfolio size that covers
(Source: Morningstar)
General Advice Warning
Any advice/ information provided is general in nature only and does not take into account the personal financial situation, objectives or needs of any particular person.

The ultimate result is that this allows managers to decide on the portfolio that represents the index’s overall risk profile, while allowing the ETF manager to avoid purchasing bonds that suffer from illiquidity. The management process is highly automated, and managers use proprietary analytical and risk control systems. The key objective is to minimise trading costs, mainly around primary market events (for example, auctions) that cause rebalancing. All trading is executed by the in-house capital markets desk. Bond coupons are reinvested in line with index rules.
Portfolio:
The Markit iBoxx USD Liquid Investment Grade Index measures the performance of the most liquid USD denominated corporate bonds with investment-grade ratings and minimum remaining life of 3 years by issuers from developed countries. To be considered for inclusion, bonds must have a minimum remaining maturity of 3.5 years and a minimum outstanding of USD 750 million. In addition, the index also requires a minimum outstanding of USD 2 billion per issuer. The index is weighted by market capitalisation, subject to an issuer overall cap of 3%.
People:
The strategy is managed by the EMEA core portfolio management team. Sid Swaminathan is the head of the core portfolio management team. This is a large team where portfolio managers specialise in two broad groupings, one focusing on rates and inflation strategies and the other on credit and aggregate funds. The portfolio managers are supported by a large team of analysts and IT professionals, as well as by the global capital markets team.
Performance:
The strategy has delivered returns above the category average in short and long periods over the past 15 years both on a total and risk-adjusted basis. The strategy struggled during the worst of the coronavirus sell-off in March 2020, but it rebounded strongly once the US Federal Reserve cut interest rates from 1.50% to just above 0.00% and started buying corporate-bond ETFs.
The annualized performance (%USD) displayed by this fund as on 31st August, 2021 has been shown below:

(Source: Factsheet from iShares.com)
Price:
The fees levied by the share class is in the cheap category. Analysts expect that this share class will be able to generate positive alpha relative to the category benchmark index, which affirms the outperformance of this ETF.

(Source: Factsheet from iShares.com) (Source: Morningstar)

(Source: Morningstar)
About ETF:
iShares USD Corporate Bond ETF tracks an index that excludes bonds with maturity below three years, which account for up to 20% of the investable universe. This causes the strategy to have higher duration than all-maturity passive alternatives. This can work both in favour and against investors depending on the path of interest rates. The strategy is expected to deliver returns over a full market cycle; that is inclusive of periods of both rising and falling interest rates. Considering the benefits of low fees and the broad diversification at the sector level, the strategy retains a Morningstar Analyst Rating of Bronze. iShares’ passive bond fund management process and the high level of expertise of the people behind it showcases a positive view of the ETF.
General Advice Warning
Any advice/ information provided is general in nature only and does not take into account the personal financial situation, objectives or needs of any particular person.