They need an advice. Young married couple talking while sitting on the therapy session with psychologist
TIAA-CREF Core Plus Bond has an experienced lead manager and the solid process remains intact, while the expansive supporting cast has only broadened. Veteran manager Joe Higgins, who has led the sibling strategy TIAA-CREF Core Bond TIBDX since 2011, took over this strategy at the end of 2020 when longtime lead manager Bill Martin retired.
Approach
Lead manager Joe Higgins continues the thoughtful relative value approach that has been in place both here and on his other charge, TIAA-CREF Core Bond TIBDX. This strategy earns an Above Average Process Pillar rating. Higgins has the ultimate authority in ensuring what holdings go into the portfolio but draws heavily on the strength and expertise offered by the sector managers, analysts, and macroeconomic strategists in identifying relative value opportunities across the fixed-income universe. The strategy can invest in everything from corporate bonds and mortgages to municipal bonds and emerging-markets debt, with the higher-risk sectors like high-yield bonds, bank loans, and emerging-markets debt ranging between 10% and 30% depending on the team’s outlook and risk appetite.
Portfolio
As of December 2021, the portfolio’s largest exposures were to investment-grade corporate bonds (24.2% of assets), agency mortgage-backed securities (18.6%), and emerging-markets debt (10.2%). The emerging markets exposure rarely if ever broke double-digit threshold, but its allocation has been on the upswing since March 2020 given the portfolio managers’ belief in its ability to outperform over the long term. The emerging markets’ relative lack of direct correlation to domestic corporate moves, as well as premium on offer from new issuance, make them attractive.
People
Joe Higgins, who replaced longtime lead manager Bill Martin at the end of 2020, is a seasoned and capable manager supported by three experienced comanagers and a robust analyst team. The strategy earns an Above Average People Pillar rating.
Performance
The strategy under Joe Higgins’ tenure has bested almost 70% of distinct peers in the intermediate core-plus bond category, keeping up with the record his predecessor Bill Martin set during his tenure from September 2011 to December 2020. Over that period, the Institutional share class returned 4.5% annualized and outpaced roughly two thirds of peers. While lagging performance punctuated this record at various points, most notably in March 2020, by and large “measured consistency” was the characteristic on display for this strategy’s performance.
(Source: Morningstar)
General Advice Warning
Any advice/ information provided is general in nature only and does not take into account the personal financial situation, objectives or needs of any particular person.
This UK vehicle has formally adopted a sustainability mandate since April 2021. The investment process starts with hard exclusions, which contains firms with material exposure to weapons, tobacco, coal miners, and oil/gas extraction, among others. The exclusion list was further extended in 2021 to include oil/gas/ nuclear power utilities and firms that the team marked to have “deteriorating” ESG momentum within their sustainability rating framework, but it still accounted for less than 5% of the MSCI AC Asia ex Japan Index, and it hasn’t been seen trigger any material changes to the portfolio over the past year. Dhananjay Phadnis has long favoured quality companies run by strong management teams that can demonstrate cinsistent value creation. It is considered the adoption of a sustainability framework a formalisation of the approach that he has already employed rather than a material change. Phadnis focuses on a firm’s competitive advantages, management quality, potential for improvement on ESG practice, and valuations in stock selection. The end portfolio consists of 50-70 names, which typically are fundamentally sound businesses trading below their intrinsic values and out-of-favour stocks with turnaround catalysts. Sector and country allocations are a residual of stock selection, though weights must stay within 10 percentage points of the index. Phadnis has done an excellent job extracting performance out of the strategy’s risk budget, and his investment savvy brings a further edge to the approach’s execution. Overall, the strategy maintains Process rating of High.
Portfolio
Dhananjay Phadnis increased the portfolio’s exposure to financials to 28.1% as of December 2021 from 19.3% a year ago, which represented a 9.4% overweighting compared with the MSCI AC Asia ex Japan Index. He added to AIA, despite it being a major underperformer in 2021. At Analysts’ January 2022 meeting, Phadnis remained positive on the insurer’s growth outlook, noting that it managed to expand its agent head count and branch out into new provinces in China when other Chinese insurers experienced difficulties in maintaining their agency force in 2021. Conversely, his conviction in Ping An Insurance waned given its slower-than-expected agency reform and its questionable decision of buying a majority stake in bankrupt Founder Group, and he has therefore exited his position. Meanwhile, the December 2021 portfolio continued to have an overweight position in information technology, where its 27.3% stake was above the index’s 25.8%. Phadnis liked SK Hynix, believing that the chipmaker’s acquisition of Intel’s NAND unit will enhance its competitiveness in the global memory market and that it has better corporate governance among Korean companies. Within consumer discretionary (16.1%), Phadnis initiated a stake in Meituan in July 2021 when its valuation became more compelling amid the regulatory crackdown. He believed the food delivery giant’s business model can adapt to new regulatory standards, noting its pricing power and efficient delivery network in the segment.
People
Dhananjay Phadnis brings 20 years of investment experience and has led this strategy’s UK and Luxembourg-domiciled vehicles since November 2013 and March 2015, respectively. He joined Fidelity in 2004 as an analyst and covered a variety of sectors before being promoted to portfolio manager in 2008. He has since posted excellent results across the single-country and regional mandates under his management, though he now focuses on this sustainable Asia equity strategy, which includes the USD 1.2 billion, Luxembourg-domiciled Fidelity Asian Equity fund that Phadnis took over from former manager Suranjan Mukherjee in August 2021. Phadnis had a total AUM of USD 6.1 billion as of December 2021. It is alleged Phadnis is one of the best Asian equity managers, who has consistently showcased astute investment savvy and a great passion for investing. Director of sustainable investing Flora Wang has been the strategy’s assistant portfolio manager since February 2021, when it formally adopted a sustainability mandate. Most of Wang’s contributions currently lie in the ESG integration front, including engaging with companies and identifying materiality issues. She is also gradually developing her fundamental stock-picking skills under Phadnis’ mentorship, and it is monitored how her role evolves. Phadnis is supported by Fidelity’s deep Asia Pacific ex Japan team of 58 analysts who average nine years of experience and six years with Fidelity. The team has showed greater stability since 2020 and has further grown with six additions in 2021 through September. Overall, the strategy continues to merit a People rating of High.
Performance
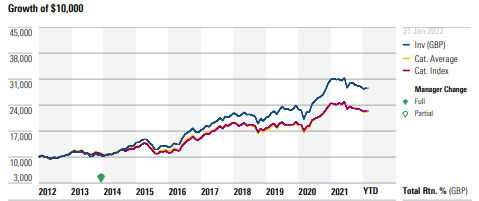
Lead manager Dhananjay Phadnis has delivered excellent results since he took over the UK-domiciled vehicle in November 2013. Through 31 Jan 2022, the W Acc share class returned 12.3% per year (in pound sterling), beating the MSCI AC Asia ex Japan Index’s 8.57% gain, the MSCI Emerging Markets Asia Index’s 8.86% gain, and 96% of its Asia ex Japan equity category peers. Its standard deviation was slightly higher than the indexes but in line with typical peers, resulting in robust risk-adjusted results. Indeed, the share class’ Sharpe ratio of 0.58 during the same period outpaced both indexes and 97% of peers. The outperformance was primarily driven by strong stock selection in China and India, with consumer discretionary, communication services, and financials contributing from a sector perspective.
Phadnis’ quality bias and prudent risk management helped buoy the strategy’s relative performance in the 2021 down market. Although the W Acc share class lost 3.2% last year, it outperformed the MSCI AC Asia ex Japan Index by 64 basis points and ranked in the 48th percentile among peers. The vehicle primarily benefited from solid stock picks in the communication services and industrials sectors, with Bharti Airtel, NAVER, and Titan Wind Energy being some of the top contributors. The underweightings in Alibaba and Tencent and not owning Pinduoduo also helped, as they plunged on the back of heightened regulatory crackdowns in 2021. Conversely, stock picks in financials and healthcare detracted.
About Fund:
Fidelity International Limited is mainly owned by management and members of the Johnson family, who founded US-based Fidelity Investments. The entities have been separate since 1980, and though there are some similarities, in practice there is only limited alignment between the two. There were a number of personnel changes in 2018-19, including a change in CEO and the CIOs of equities, fixed-income, and multiasset, but the composition of senior management has been relatively stable since. More important, these changes do not seem to have negatively affected day-to-day investment activities, and on the whole, the initiatives undertaken by new management seem sensible.
(Source: Morningstar)
General Advice Warning
Any advice/ information provided is general in nature only and does not take into account the personal financial situation, objectives or needs of any particular person.
Vanguard’s efficient, low-cost method provides series’ investors with broad market exposure. The sensible and well-executed approach earns a renewed Above Average Process rating. The equity exposure of the four funds in the lineup (Vanguard LifeStrategy Income VASIX, Vanguard LifeStrategy Conservative Growth VSCGX, Vanguard LifeStrategy Moderate Growth VSMGX, and Vanguard LifeStrategy Growth VASGX) is 20%, 40%, 60%, and 80%, respectively. Vanguard’s strategic asset allocation committee and the investment strategy group provide oversight for the fund series. On an annual basis, the committee reviews the allocations, leveraging research produced by the investment strategy group. The committee takes a cautious tack, which results in a relatively modest approach to implementation changes. Prior to 2011, the series included an allocation to a tactical asset allocation strategy, but that piece was removed, resulting in an exclusively passive underlying fund lineup and strictly strategic procedure. International bond exposure was introduced to the series in 2013, and in 2015 international exposure was increased within both the equity and the fixed-income sleeves: non-U.S. stock exposure increased to 40% from 30% and non-U.S. bond exposure increased to 30% from 20%. The firm’s research suggests that a market-cap weighted approach delivers broad exposure and effectively diversifies the funds but cites investors’ home-country preferences.
Portfolio
As of early 2022, the strategies comprising each portfolio receive compelling ratings. The series’ equity sleeves hold Silver-rated Vanguard Total Stock Market Index VTSMX and Gold-rated Vanguard Total International Stock Index VGTSX. On the fixed-income side, the funds tap Vanguard Total Bond Market II Index VTBIX and Vanguard Total International Bond Index VTIBX, both rated Bronze. The latest addition, Vanguard Total International Bond Index II VTIIX, was launched in February 2021 as a clone of Vanguard Total International Bond Index. The fund is exclusively used in the LifeStrategy and the target retirement series, allowing Vanguard to separate transaction costs generated by the massive target retirement series and LifeStrategy from those generated by other investors. Managers began transitioning the international bond exposure to the clone fund in March 2021 and will continue to do so in a tax-sensitive manner. In the wake of a volatile early 2020, the firm updated the threshold rebalancing policy for multi-asset strategies. Prior to 2021, the rebalancing policy stipulated allocation guardrails of 75 basis points; if exceeded, managers rebalanced the allocations to within 50 basis points of the benchmark. As of Jan. 1, 2021, the new guardrails sat at 200 basis points; if exceeded, managers rebalanced the portfolios to within 100 basis points of the target allocations. This change is reasonable and should reduce the strategy’s rebalancing frequency as intended.
People
Experienced leadership, a multigroup approach, and robust teams across Vanguard merit a renewed Above Average People rating. The LifeStrategy series is managed by the same teams that oversee the firm’s target retirement funds. Vanguard’s strategic asset allocation committee is responsible for ongoing oversight of multi-asset funds. The committee’s 10 voting members include senior leaders across the firm, such as its global chief economist, who also serves as the committee chair. The strategic asset allocation committee is supported by the firm’s investment strategy group, which is composed of a global network of more than 70 investment professionals. Their research covers an array of topics ranging from investor behavior to portfolio construction. Management of the underlying index funds remains stable and well-resourced. Gerard O’Reilly and Walter Nejman manage the U.S. equity index fund, while Michael Perre and Christine D. Franquin cover the international counterpart. O’Reilly and Perre each have roughly three decades of tenure at Vanguard. Franquin and Nejman have spent 21 and 16 years at Vanguard, respectively. Fixed-income manager Joshua Barrickman joined the firm in 1998 and assumed the role of head of fixed-income indexing in the Americas in 2013. Barrickman manages both the domestic and international bond strategies.
Performance
Over the trailing 10 years ended January 2022, three of the four funds outperformed their target risk Morningstar Category benchmarks and their allocation fund category peer medians in total annualized returns, respectively. The Moderate Growth fund was the exception: it managed to outpace its Morningstar Moderate Target Risk Index category benchmark but underperformed the typical peer in the competitive allocation — 50% to 70% equity category. On a risk-adjusted basis (as measured by Sharpe ratio) over the same period, all four portfolios outperformed their category benchmarks and their average peer constituent. Notably, the two most conservative funds of the series both landed in the best performing deciles of their respective category peer groups while the most risk-tolerant fund landed in the best performing quintile of the allocation — 70% to 85% equity category group.
The series’ bond sleeves have a higher duration profile relative to peers, which results in greater sensitivity to changes in interest rates. The recent low-yield environment and threat of rising rates presented a challenge to the profiles here, and for the one-year return ended January 2022, all four portfolios underperformed their respective category peer averages and three of the four underperformed their respective category benchmarks. Only the Growth fund outpaced its Morningstar Moderate Aggressive Target Risk Index category benchmark in that period.
About Fund:
The Vanguard Group earns a High Parent rating for its investor-centric ethos, reliable strategies, and democratization of advice. Vanguard is the asset-management industry’s only client-owned firm, and it shows. Vanguard uses the money that its passive strategies make from securities lending to lower if not eliminate headline expense ratios. Modest fees, capable subadvisors, and performance incentives spur its active business to competitive results. Vanguard also offers advice, human and digital, at an accessible cost. All of this helped its global assets under management grow to USD 7.5 trillion as of March 31, 2021. Yet, Vanguard’s non-U.S. business only accounts for a fraction of its assets. Incumbents within many of these markets have sought to keep this low-cost provider at bay. Vanguard has shifted from leading with exchange-traded funds to using advice for entry, such as its joint venture with China’s Ant Financial to offer a mobile-based retail service, which had more than 1 million Chinese users a year after its April 2020 launch.
(Source: Morningstar)
General Advice Warning
Any advice/ information provided is general in nature only and does not take into account the personal financial situation, objectives or needs of any particular person.
Trades at a 2.2x Price to Book, and dividend yield of ~4.0%, however the stock trades at a premium to its peer group.
$2bn on-market buyback should support CBA’s share price.
Improving macroeconomic environment which may see favourable higher interest rate hikes.
Post Covid-19 expected low levels of impairment charges (especially as a low interest rate environment helps customers and arrears).
Potential pressure on net interest margins as competition intensify with other major banks.
Sector leading return on tangible equity.
A well-diversified corporate book.
Improving CET1 ratio, which may in due course provide opportunity to undertake capital management initiatives.
Bulls Says
Intense competition for loan, as overall market growth rate moderates.
Trades at a premium to peer group, with high competition potentially eroding its ROE.
Major banks, including CBA, are growing below system growth (i.e. losing market share).
Increase in bad and doubtful debts or increase in provisioning.
Funding pressure for deposits and wholesale funding (increased funding costs).
Regulatory and compliance risk
Australian housing property crash.
1H22 Results Highlights
Statutory NPAT of $4,741m, up 26%. Cash NPAT of $4,746m, up +23% driven by strong operating performance, lower remediation costs and lower loan loss provisions on improved economic outlook, offsetting weaker margins.
Operating income of $12,205m, up 2%, on ongoing volume growth and improved volume driven fee income, partly offset by weaker net interest margin.
Operating expenses was largely flat at $5,588m in 1H22 with higher staff costs to support higher volumes offset by lower occupancy, IT and remediation costs. CBA’s cost to income ratio of 45.8% was an improvement from 46.7% in 1H21.
Net interest margin (NIM) was down 14 basis points to 1.92%. According to management, excluding the impact from increased lower yielding liquid assets, CBA’s NIM declined 5 bps on higher switching to lower margin fixed home loans, the impact of the rising swap rates due to market expectations of higher interest rates, and intense competition.
Loan impairment expense declined $957m to a benefit of $75m reflecting an improved economic outlook. Loan loss provisions remain significantly higher than the expected losses under the central economic scenario.
Company Profile
Commonwealth Bank of Australia (CBA) is one of the major Australian Banks. Its key segments are retail, business and institutional banking, wealth management, New Zealand and Bankwest. Across these core segments, the bank provides services in retail, corporate and general banking, international financing, institutional banking, stock broking and funds management.
(Source: BanyanTree)
General Advice Warning
Any advice/ information provided is general in nature only and does not take into account the personal financial situation, objectives or needs of any particular person.
Wesco operates in very fragmented markets, but its large scale, global footprint, expansive product portfolio and supplier base, and service offerings differentiate it from smaller local and regional competitors. Service offerings, such as vendor-managed inventory, efficiency assessments, product repairs, and training, generate a meaningful portion of Wesco’s sales and are key components of the firm’s value proposition to customers. Wesco’s size is also an important competitive advantage because the company has the scale to serve large, multinational clients anywhere in the world. Wesco doubled in size after it completed its acquisition of close peer Anixter in June 2020.
Financial Strength
Wesco’s $4.7 billion acquisition of close peer Anixter International in June 2020 caused the firm’s net debt/EBITDA ratio (excluding synergies) to swell to 5.7. However, Wesco’s elevated free cash flow generation in 2020 allowed the firm to reduce net debt by $389 million, finishing 2020 with a 5.3 net leverage ratio. Wesco’s leverage ratio continued to decline as 2021 progressed, and the firm finished the year with a 3.9 net debt/adjusted EBITDA ratio. At the end of 2021, Wesco had $4.7 billion of debt, but modeling about $4.2 billion of free cash flow over the next five years. Wesco has a proven ability to generate free cash flow throughout the cycle. Indeed, it has generated positive free cash flow (defined as operating cash flow less capital expenditures) every year since its 1999 initial public offering, and its free cash flow generation tends to spike during downturns due to reduced working capital requirements.
Wesco delivered 16% organic revenue growth during the fourth quarter, and gross profit margin and adjusted EBITDA margin expanded 120 and 140 basis points to 20.8% and 6.6%, respectively. All three of Wesco’s segments delivered revenue growth and adjusted EBITDA margin expansion during the quarter, and the firm’s backlog has reached a record level, which bodes well for 2022 growth prospects. Management expects revenue to increase 5%-8% in 2022, adjusted EBITDA margin of 6.7% to 7.0% (20-50-basis point improvement), and adjusted EPS of $11.00-$12.00
Bulls Say’s
Wesco’s transformative acquisition of Anixter should result in stronger growth and profitability, which should help the stock fetch a higher multiple.
Wesco’s global footprint and focus on value-added inventory management services help the firm take market share from smaller distributors and support pricing power.
Despite serving cyclical end markets, Wesco’s business model generates strong free cash flow throughout the cycle. The firm will likely continue to use its cash flow to fund organic growth initiatives, acquisitions, and share repurchases.
Company Profile
Wesco International is a value-added industrial distributor that has three reportable segments, electrical and electronic solutions, communications and security solutions, and utility and broadband solutions. The company offers more than 1.5 million products to its 125,000 active customers through a distribution network of 800 branches, warehouses, and sales offices, including 42 distribution centers. Wesco generates 75% of its sales in the United States, but it has a global reach, with operations in 50 other countries.
(Source: Morningstar)
General Advice Warning
Any advice/ information provided is general in nature only and does not take into account the personal financial situation, objectives or needs of any particular person.
It is anticipated Sysco possesses a narrow moat, rooted in its cost advantages. It is concluded that the firm benefits from lower distribution cost given its closer proximity to customers, complemented by scale-enabled cost advantages such as purchasing power and resources to provide value-added services to its customers. While COVID-19 created a very challenging environment, the food-service market has nearly fully recovered, with sales at 95% of prepandemic levels as of the end of 2021, and Sysco has emerged as a stronger player, with $2 billion in new national account contracts (3% of prepandemic sales) and a 10% increase in independent restaurant customers.
In 2021, Sysco laid out its three-year road map, termed “recipe for growth” which will be funded by the elimination of $750 million in operating expenses between fiscals 2021 and 2024. The plan should allow Sysco to grow 1.5 times faster than the overall food-service market by fiscal 2024. Sysco is investing to eliminate customer pain points by removing customer minimum order sizes while maintaining delivery frequency and lengthening payment terms. It improved its CRM tool, which now uses data analytics to enhance prospecting, rolled out new sales incentives and sales leadership, and is launching an automated pricing tool, which should sharpen its competitive pricing while freeing up time for sales reps to pursue more value-added activities, such as securing new business. Sysco is also developing the industry’s first customized marketing tool, harnessing its significant customer data to generate tailored messaging that should resonate with each customer. In pilots, this practice increased Sysco’s share of wallet. Further, Sysco has switched to a team-based sales approach, with product specialists that should help drive increased adoption of Sysco’s specialized product categories such as produce, fresh meats, and seafood. Lastly, Sysco is launching teams that specialize in various cuisines (Italian, Asian, Mexican) that should drive market share gains in ethnic restaurants. Looking abroad, Sysco has a new leadership team in place for its international operations, increasing the confidence that execution will improve.
Financial Strength
It is seen Sysco’s solid balance sheet, with $3.4 billion of cash and available liquidity (as of December) relative to $11 billion in total debt, positions the firm well to endure the pandemic. Sysco has a consistent track record of annual dividend increases, even during the 2008-09 recession and the pandemic. It is foreseen 5%-10% annual increases each year of Analysts’ forecast, maintaining its target of a 50%-60% payout ratio.Sysco has historically operated with low leverage, generally reporting net debt/adjusted EBITDA of less than 2 times. Leverage increased to 2.3 times after the fiscal 2017 $3.1 billion Brakes acquisition, and above 3 times in fiscals 2020 and 2021, given the pandemic. But it is anticipated leverage will fall back below 2 by fiscal 2023, given debt paydown and recovering EBITDA. Analysts’ forecast calls for free cash flow averaging 3% of sales annually over the next five years. In May 2021, Sysco shifted its priorities for cash in order to support its new Recipe for Growth strategy. It’s new priorities are capital expenditures, acquisitions, debt reduction when leverage is above 2 times, dividends, and opportunistic share repurchase. Its previous priorities were capital expenditures, dividend growth, acquisitions, debt reduction, and share repurchases. In fiscal 2022-24, as it invests to support accelerated growth, Sysco should spend 1.3%-1.4% of revenue on capital expenditures (falling to 1.1% thereafter). Sysco completed the $714 billion acquisition of Greco and Sons in fiscal 2021, and it is projected for it to invest about $100 million to $200 million annually on acquisitions thereafter. Finally, Analysts’ model $500 million-$600 million in annual expenditures to buyback about 1% of outstanding shares annually. It is foreseen as a prudent use of cash when shares trade below Analysts’ assessment of intrinsic value.
Bulls Say’s
As Sysco’s competitive advantage centers on its position as the low-cost leader, it is projected Sysco should be able to increase market share in its home turf over time.
Sysco has gained material market share during the pandemic, allowing it to emerge a stronger competitor.
Sysco’s overhead reduction programs should make it more efficient, enabling it to price business more competitively, helping it to win new business, and further leverage its scale.
Company Profile
Sysco is the largest U.S. food-service distributor, boasting 17% market share of the highly fragmented food-service distribution industry. Sysco distributes over 400,000 food and nonfood products to restaurants (66% of revenue), healthcare facilities (9%), education and government buildings (8%), travel and leisure (5%), and other locations (14%) where individuals consume away-from-home meals. In fiscal 2021, 83% of the firm’s revenue was U.S.-based, with 8% from Canada, 3% from the U.K., 2% from France, and 4% other.
(Source: MorningStar)
General Advice Warning
Any advice/ information provided is general in nature only and does not take into account the personal financial situation, objectives or needs of any particular person.
Shot of elegant smart businesswoman explaining a project to his colleagues with statistics on the computer on coworking place.
Investment Thesis:
Trading below our valuation.
Fundamentals for the vehicle aftermarket continue to remain strong (with increase in second-hand vehicle sales; travellers seeking social distancing and hence moving away from public transport; with Covid lockdown measures in forced, more people are spending their holidays domestically utilizing their vehicles).
Significant opportunities within BAP to drive growth (expanding network; increase market share by leveraging BAP’s Victorian DC; enhance supply chain efficiencies; driven own brand growth).
Strong earnings growth profile.
Further opportunity to grow gross profit margins from better buying terms with tier one and two suppliers.
Significant distribution network across Australia to leverage from.
Ongoing bolt on acquisitions and associated synergies.
Growing BAP’s own brand strategy, which should be a positive for margins. BAP is on track to reach their 5-year targets to supplement market leading brands with BAP’s own brand products.
Weak macro story of leveraged Australian consumer and lower growth environment persisting.
Thailand represents a meaningful opportunity in our view.
Key Risks:
Rising competitive pressures.
Value destructive acquisition.
Rising cost pressures eroding margins (e.g. more brand or marketing investment required due to competitive pressures).
Given the high trading multiples the stock trades at, a disappointing earnings update could see the stock price significantly re-rate lower.
Integration (and therefore synergies) of recent acquisitions underperform market expectations.
Execution risk around Thailand.
Key highlights:
BAP struggled against Covid-19 lockdowns and restrictions over 1H22, delivering revenue growth of +1.9% over pcp to $900.1m, with own brand sales percentage increasing across all segments, with revenue picking up during 2Q, in line with easing restrictions. Management expects to achieve strong growth in 2H22. 1H22 EBITDA fell -5.8%, impacted by the transition to its Victoria distribution centre and support provided to staff. The Company made some significant leadership changes, appointing former CFO Noel Meehan as the new CEO following CEO/Managing Director Darryl Abotomey’s retirement. BAP has ample balance sheet liquidity.
Capital management.(1) The Board declared a fully franked interim dividend of 10cps, up +11.1% over pcp. (2) The balance sheet remained strong with ample liquidity with cash increasing +101.5% over 2H21 to $79.8m and net debt of $203M (up +23.7% over 2H21) leading to a leverage ratio of 1.0x, providing the Company with significant financial flexibility to be able to respond rapidly to acquisition opportunities and continue to invest in high returning projects. (3) Management continued investments in locations to support Truckline and Autobarn networks, expanded geographic footprint with BAP now having a presence in over 1,100 locations throughout Australia, New Zealand and Thailand, and signed 2 acquisitions adding annualised revenue of $50m at mid-single digit EBITDA multiples (pre-synergies).
Supply chain. Management continued to develop group logistics capabilities, transitioning three largest warehouses in Victoria, Nunawading (Retail), Preston (Trade) and Derrimut (Wholesale) which represent 80% of volumes, to new consolidated distribution centre at Tullamarine, which is expected to deliver operating expense savings of $10m and inventory improvement of $8m.
New CEO appointed. Following CEO and Managing Director Darryl Abotomey’s retirement, the Company has appointed former CFO Noel Meehan as the new CEO, with recruitment for a new CFO currently underway. In our view, this is a good outcome and more likely to lead to a stability in strategy.
Growing proportion of private label sales. Own brand sales percentage increased across all segments, with Bapcor Trade delivering 29.6% (up +50bps over 2H21), Retail delivering 33.9% (up +120bps over 2H21), Speciality Wholesale delivering 54.6% (up +130bps over 2H21) and New Zealand delivering 30.3% (up +40bps over 2H21), with the Company remaining on track to reach its 5-year targets to supplement market leading brands with BAP’s own brand products, which should be a positive for margins.
Company Description:
Bapcor Ltd (BAP) is Australasia’s leading provider of aftermarket parts, accessories and services. The core businesses of BAP are: (1) Trade – Burson Auto Parts is a trade focused parts professional supplying workshops with all their parts and accessories. (2) Retail – Autobarn is the premium retailer of auto accessories and Opposite Lock specializes in 4WD accessory specialists. (3) Independents – supporting the independent parts stores via the group’s extensive supply chain capabilities and through brand support. (4) Specialist Wholesaler – the number 1 or 2 industry category specialists in parts supply programs. (5) Services – experts at car servicing through Midas and ABS.
(Source: Banyantree)
General Advice Warning
Any advice/ information provided is general in nature only and does not take into account the personal financial situation, objectives or needs of any particular person.
85215903 - attractive businessman using mobile phone while having lunch
Investment Thesis
On track to achieve FY22 production and operational guidance.
Commodities price (Gold) surprises on the upside especially due to geopolitical tensions.
Leveraged to changes in theUSD.
Solid assets with reserve/resource.
New acquisitions provide upside (resource and operational improvement).
Strong management team with significant mining expertise.
Strong balance sheet.
Company has a good track record on shareholder return
Key Risk
Further deterioration in global macroeconomic conditions.
Deterioration in global gold supply & demand equation.
Deterioration in gold prices.
Production issues, delay or unscheduled mine shutdown.
Adverse movements in AUD/USD.
1H22 Results Key Highlights: Relative to the pcp:
Revenue of A$1,807m was up +63%, mainly driven by higher gold volumes, with gold sales 289,786 ounces higher. Reported NPAT of A$261m, was up +43% (or Underlying NPAT of A$108m, excluding significant items of A$153m) was driven by higher production.
Underlying EBITDA of A$699m, was up +47%, on a margin of 39%. Cost of sales were higher than the pcp due to increased activity with the inclusion of the Saracen Minerals Holdings’ merger assets in the current half (107% increase period on period), higher average cash costs per ounce (H1 2022: A$1,256/oz vs H1 2021: A$1,196/oz) and the increase in D&A unit costs (increase of A$291/solid oz), due to the required non-cash uplift to fair value of the merger assets, compared to the historic cash cost of those same assets.
NST saw cash earnings of A$430m.
NST retained a strong balance sheet with cash and bullion of A$588m; net cash of A$288m.
The Board declared a fully franked interim dividend of 10cps, up +5%.
NST remains on track with its key growth projects progressing as expected to become a 2Mozpa producer by FY26, including KCGM open pit development (Kalgoorlie) and Thunderbox mill expansion (Yandal).
In 1H22, NST made net repayment of A$361m of corporate bank debt, completed its acquisition of Newmont’s power business for A$130m and made a A$170m investment in a Convertible Debenture with Osisko Mining Inc. NST also sold Kundana Assets realising A$402m (and contributing a pre-tax gain of A$242m).
Company Profile
Northern Star Resources Limited (Northern Star) is a gold production and exploration company with a Mineral Resource base of 10.2 million ounces and Ore Reserves of 3.5 million ounces, located in highly prospective regions of Western Australia and the Northern Territory. NST is the third largest gold producer in Australia. The Company also recently acquired a gold mine in Alaska.
(Source: Banyantree)
General Advice Warning
Any advice/ information provided is general in nature only and does not take into account the personal financial situation, objectives or needs of any particular person.
Modern financier with papers sitting in front of computer monitor with chart and graph of sales rate
Investment Thesis:
Well positioned as a market leader in e-commerce and cloud computing.
Strong operating cash flow profile provides the Company with significant amount of flexibility.
Large base of loyal customers.
Strong senior executive team.
Entry into new regions (e.g. India) – although this is not without risk.
Re-accelerating investment expenditure should be positive for future revenue and earnings growth.
Key Risks:
It is a complex business with a lot of moving parts, thus forecasting future earnings can be difficult.
Further de-acceleration in advertising revenue.
Increased investments fail to yield adequate returns to justify AMZN’s trading multiples.
Increased e-commerce competition domestically and internationally.
Decrease in operating margins of AWS due to increased competition and price cuts.
Increased regulatory scrutiny (India being a good example).
Increase in overheads like free shipping and higher labor cost leading to margin contraction.
Key highlights:
Relative to the previous corresponding period (pcp), 4Q21 group net sales were up +9% to $137.4bn, driven by AWS (up +40%) and Advertising Services (up +32%).
Operating income of $3.5bn was down -49% (due to inflationary pressures and disruptions to operations from Covid-19) and net income increased +99% to $14.3bn, predominantly due to the pre-tax valuation gain of $11.8bn on AMZN’s investment in Rivian Automotive Inc.
AWS (Amazon Web Services), with net sales up +40% YoY, had another very strong quarter despite lapping strong growth rates in previous periods (4Q20 was up +28%).
AMZN will increase the price of Prime in the U.S. in 1Q22, but at this stage has no plans to raise rates in any other region.
AWS is currently available in 25 regions globally, with management looking to launch in 8 more regions in the next few years.
Management provided good colour around staffing challenges on the analysts briefing and believe they may be through the peak of it.
Company Description:
Amazon.com Inc. (AMZN) is a multinational technology company focusing in e-commerce, cloud computing and artificial intelligence. It is the largest e-commerce marketplace and cloud computing platform in the world as measured by revenue and market capitalization. The company operates through three segments; North America, International and Amazon Web Services (AWS).
(Source: Banyantree)
General Advice Warning
Any advice/ information provided is general in nature only and does not take into account the personal financial situation, objectives or needs of any particular person.
Raytheon Technologies is composed of United Technologies’ aerospace businesses and legacy Raytheon, each of which is a powerhouse in the commercial aerospace supply chain and defense prime contracting industries, respectively. The combined entity is fundamentally unique due to its relatively even balance between commercial aerospace and defense prime contracting; most other entities in the industry are heavily skewed one way or the other.
In commercial aerospace, Pratt and Whitney, Raytheon’s jet engine manufacturer, is amid a large ramp up for the Geared Turbofan engine to support its placement on the popular A320neo family of aircraft. Engines are a razor-and-blade business, with the razor being the original component sale and the blade being servicing. Pratt has narrow-body exposure A320s through the V2500 engine and to the A320neo and the A220 via the GTF engine. While it is somewhat concerning, that some older A320s will be retired during the pandemic, it is viewed long-term tailwinds for the GTF. Collins Aerospace is one of the largest diversified commercial component suppliers, and it is held, that the segment’s substantial scale and scope give it negotiating leverage with the aircraft manufacturers, as they can choose to not put in a bid on critical components of new aircraft.
Within defense, Raytheon is exposed to missiles, missile defense systems, space militarization, and IT services for the government. It is anticipated that the military’s increased focus on defending against great powers conflict will drive material investment in each of these exposures, excluding government IT services. The fiscal stimulus used to support the U.S. economy during the COVID-19 pandemic dramatically increased the U.S. debt and higher debt levels are usually a forward indicator of fiscal austerity. It is likely a flattening, rather than declining, budgetary environment as it is held that heightened geopolitical tensions between great powers are likely to buoy spending despite the debt burden. It is likely that contractors can continue growing despite a slowing macro environment due to sizable backlogs and the national defense strategy’s increased focus on modernization.
Financial Strength
Raytheon Technologies is materially deleveraging from the spin-offs of Otis Elevators and Carrier, as well as merging in an all-equity transaction with a much less leveraged Raytheon. It was historically seen that United Technologies carried too much debt from the Rockwell Collins acquisition, roughly three and a half turns of gross debt/EBITDA in 2019 but were confident in the firm’s financial health due to long-term revenue visibility stemming from the large backlogs at the aircraft manufacturers. As it stands today, Analysts’ are more confident in the firm’s capacity to service its relatively smaller debt burden because it will be taking on an ultra-long cycle defense prime contracting business, which has decades of revenue visibility and regulated margins, so Analysts’ are confident in Raytheon Technologies’ ability to service the debt load, the underfunded pension, and the dividend. Analysts’ estimate the firm will end 2022 with gross debt at about 2.7 times EBITDA, it is awaited that the company will continue to deleverage for the time being, so that the company would be positioned to potentially re-lever for an acquisition a few years down the road. Given that the substantial consolidation that has already occurred in the defense prime contracting industry makes it difficult to find potential hardware contractors to acquire and there has always been a lack of potential targets for Pratt & Whitney, it is held that Raytheon Technologies would acquire one of the many component manufacturers in the aerospace supply chain to Collins Aerospace.
Bulls Say’s
Pratt & Whitney’s placement on the A320 family and A220 aircraft should substantially increase the company’s installed base of engines, which would unlock decades of high-margin servicing revenue.
The firm’s missile and missile defense segment produces products that are prioritized by the National Defense Strategy, which should lead to consistent growth.
Raytheon Technologies is well balanced between commercial aerospace and defense, which would partially insulate the combined firm from a downturn in either segment.
Company Profile
Raytheon Technologies is a diversified aerospace and defense industrial company formed from the merger of United Technologies and Raytheon, with roughly equal exposure as a supplier to the commercial aerospace manufactures and to the defense market as a prime and subprime contractor. The company operates in four segments: Pratt & Whitney, an engine manufacturer, Collins Aerospace, which is a diversified aerospace supplier, and intelligence, space and airborne systems, a mix between a sensors business and a government IT contractor, and integrated defense and missile systems, a defense prime contractor focusing on missiles and missile defense hardware.
(Source: MorningStar)
General Advice Warning
Any advice/ information provided is general in nature only and does not take into account the personal financial situation, objectives or needs of any particular person.
Laverne Securities Pty Ltd, ACN 629 216 477, T/As Investor Desk, is a Corporate Authorised Representative of Laverne Capital Pty Ltd (AFSL 482937). This service is administered by OpenInvest Limited ACN 614 587 183 via the OpenInvest Portfolio Service ARSN 628 156 052. This website provides factual information about the service, and any general advice contained does not take into account your objectives, financial situation or needs. Before making any investment decision, please review the PDS and Target Market Determination available at https://www.investordesk.com.au/key-documents/. Should you require assistance in determining whether an investment in the service is right for you, you may wish to seek personal advice from an appropriately licensed financial adviser.