Categories
Dividend Stocks

Nine Entertainment Co reported a solid 1H22 result; Strong growth in Company’s digital assets and its FTA TV asset

Investment Thesis

  • Upside potential to NEC’s share price from investors ascribing a higher value for Stan, NEC’s subscription video of demand (SVOD). Stan is now cash flow positive and profitable, with margins having the potential to surprise on the upside. 
  • Relatively attractive dividend yield of ~4%. 
  • NEC is now a much more diversified business, with revenue not dominated by traditional FTA TV but also attractive digital platforms and assets. 
  • Cost out strategy – looking to remove $230m in structural costs.  
  • Corporate activity given NEC’s strategic assets.
  • Trading below our valuation. 

Key Risks

  • Competitive pressure in Free to Air (FTA) TV and SVOD. 
  • Stan growth (subscriber numbers or breakeven point) disappoints market expectations. 
  • Structural decline in TV audiences continues to impact sentiment towards the stock. 
  • Deterioration in advertising markets.
  • Cost blowouts in obtaining new programming/content.
  • Increased competition from Netflix and Disney.

1H22 result highlights. 

  • Group revenues of $1.33bn was up +15% on pcp and group operating earnings (EBITDA) of $406.3m was also up +15% on pcp, driven by ongoing momentum in advertising and subscription businesses. Group NPAT of $212.9m was up + 20% on pcp. 
  •  EPS of 12.5cps was up +20% and the Company declared a fully franked dividend of 7cps (up +40% YoY), which equates to 56% of NPAT. 
  •  NEC retains a very strong balance sheet with net leverage (wholly owned) of 0.1x and net debt of $63m. 
  • Management noted that CY22 has started strongly across all platforms and advertisers, across all major categories. NEC retains a strong balance sheet, with a (wholly owned) leverage ratio of 0.1x, which in as per analyst view at some point will provide management with the option to undertake value accretive inorganic growth initiatives or additional capital management.
  •  Positive on the medium-term earnings outlook for NEC and are attracted to a diverse asset base (including Stan / Domain). With the stock trading on a reasonable dividend yield of ~5% (fully franked) and below our valuation, and thus maintain Buy recommendation by banyantree analysts.

Company Profile

Nine Entertainment Co (NEC), through its subsidiaries, broadcast news and current affairs, sporting events, comedy, entertainment and lifestyle programs. Nine Entertainment serves customers throughout Australia. NEC has repositioned itself from a linear free-to-air broadcaster, to a creator and distributor of cross-platform, premium content. While the channel Nine Network remains core, it is now complemented by subscription video on demand (SVOD) provider Stan, a live streaming and catch-up service 9Now, digital network nine.com.au and array of digital content.

(Source: Banyantree)

General Advice Warning

Any advice/ information provided is general in nature only and does not take into account the personal financial situation, objectives or needs of any particular person.

Categories
Dividend Stocks

Magellan Financial Group posted strong result; Announced bonus issue and share buyback

Investment Thesis

  • Principal Investments could grow to become a meaningful contributor to group performance over the medium-to-long term. 
  • MFG no longer trades at a significant premium to its peer-group post the recent de-rating. 
  • Acquisitions could pave growth runways, helping to ease the Company’s fund capacity constraints.
  • Average base management fee (bps) per annum (excluding performance fee) continues to be stable but there are risks to the downside from pressures on fees (which is an industry trend not specific to MFG alone).
  • Continued strong investment performances, especially in the global and infrastructure funds.
  • Growing levels of funds under management.  
  • New strategies could significantly increase the addressable market and help sustain earnings growth. 

Key Risk

  • Decline in fund performance.
  • Risk of potential funds outflow – both retail and institutional (loss of a large mandate).
  • Execution risk with the acquisitions.
  • Significant key man risk around Hamish Douglass and key management or investment management personnel.
  • New strategies fail to add meaningful earnings to the group. 

1H22 results summary :Compared to pcp: 

  • Adjusted revenue increased +15% to $384.1m, driven by a +13% increase in total management and service fee revenue amid +12% increase in average FUM to $112.7bn and +116% increase in other revenue (includes distribution income of $8.6m, realised capital gains of $8.1m and net FX gain of $2.1m), partially offset by -8% decline in performance fees. 
  •  Adjusted expenses increased +24% to $65.3m with Funds Management business’s cost to income ratio (excluding performance fees) increasing +60bps to 17.4% (excluding earnings contribution from SJP, increased +280bps to 19.6%) and management anticipating Funds Management segment expenses for FY22 to be $125-130m. 
  • Adjusted NPAT of $248.1m increased +16%, and excluding the earnings contribution for the period from the St James’s Place mandate, adjusted NPAT was $212.5m, broadly in line with pcp. 
  •  Strong balance sheet with no debt and total investment assets of $1,016.7m (up +13%) including cash position of $291.5m. 

Capital management

  • Declared a 75% franked interim dividend of 110.1cps, up +13% over pcp and confirmed the dividend policy of 90-95% payout of the profit after tax of the Funds Management business. 
  •  Announced intention to progress with a 1-for-8 bonus issue of options to shareholders and issuance of 10 million unlisted options to staff, both at exercise price of $35 per option and 5-year term (exercisable at any time until expiry). 
  • Taking into consideration the implementation of an on-market share buy-back (subject to various factors including market conditions).  

Company Profile

Magellan Financial Group Ltd (MFG) is a specialist funds management business. MFG’s core subsidiary, Magellan Asset Management Ltd, manages ~$53.6bn of funds under management across its global equities and global listed infrastructure strategies for retail, high net worth and institutional investors. 

(Source: Banyantree)

General Advice Warning

Any advice/ information provided is general in nature only and does not take into account the personal financial situation, objectives or needs of any particular person.

Categories
Technology Stocks

Veeva’s CRM Application Propelled It to Become Leading Solution Of It’s Niche Market

Business Strategy and Outlook

Veeva is the leading provider of cloud-based software solutions tailored to the life sciences industry, providing an ecosystem of products to address the operating challenges and regulatory requirements that these companies face. Its highly specialized offerings for the life science industry allow companies to improve operational efficiency to get products to market faster while ensuring regulatory compliance and ultimately sell more effectively. Its effective technology and dominant position enable Veeva to generate excess returns commensurate with a wide-moat company. Its strong retention, continued development of new applications, increasing penetration with existing customers, addition of new customers, and expansion into industries outside of life sciences should allow the company to extend its market leadership, in Analysts view. 

The company operates in two categories. Commercial solutions entail vertically integrated customer relationship management services and end-market data and analytics solutions. R&D solutions is a horizontally integrated content and data manager. Veeva’s CRM application supports real-time collaboration and regulatory oversight and enables incremental add-on solutions. The incremental functionality is critical to improving marketing programs while remaining in compliance with mandated antikickback laws and statutes. This service has been well received by the life sciences industry and has propelled Veeva to become the leading solution with the lion’s share (approximately 80%) of this niche market. As a follow-on to the initial introduction of CRM, management introduced R&D solutions to broaden the portfolio that addresses the largely unmet needs of the life sciences industry outside of CRM. Each module offers features and functionality targeting four key areas in life sciences: clinical (trial management), regulatory (compliance), quality of manufacturing, and safety.

Financial Strength

It is held Veeva enjoys a position of financial strength arising from its strong balance sheet (no debt) and leading position in a growing market. As of fiscal 2022, Veeva had over $2.4 billion in cash and short-term investments and no debt. It is likely the company will continue to use the cash it generates from operations to fund future growth opportunities. From Analysts perspective, management has been disciplined about M&A and taking on debt. The 2019 acquisition of Crossix was the firm’s largest to date, at approximately $430 million. It is anticipated the company will continue make small tuck-in acquisitions and fund them through available cash and cash flow from operations. Even in this scenario, increasing liquidity is foreseen, as the firm’s reserve of cash should continue to increase.

Bulls Say’s

  • Veeva’s best-of-breed vertical addressing unmet needs provides opportunities to further penetrate a highly fragmented market. 
  • The rapid adoption of the company’s new modules continues to entrench Veeva in mission-critical operations of customers, making it increasingly challenging for competitors to gain a foothold. 
  • Veeva’s institutional knowledge and codevelopment partnerships with customers enable the company to develop robust offerings addressing market needs.

Company Profile 

Veeva is a leading supplier of software solutions for the life sciences industry. The company’s best-of-breed offering addresses operating and regulatory requirements for customers ranging from small, emerging biotechnology companies to departments of global pharmaceutical manufacturers. The company leverages its domain expertise and cloud-based platform to improve the efficiency and compliance of the underserved life sciences industry, displacing large, highly customized and dated enterprise resource planning systems that have limited flexibility. As the vertical leader, Veeva innovates, increases wallet share at existing customers, and expands into other industries with similar regulations, protocols, and procedures, such as consumer goods, chemicals, and cosmetics. 

(Source: MorningStar)

General Advice Warning

Any advice/ information provided is general in nature only and does not take into account the personal financial situation, objectives or needs of any particular person.

Categories
Technology Stocks

Fineos Shares Remain Disconnected to Fair Value

Business Strategy and Outlook

Fineos is a core software vendor to the global life, accident, and health, or LA&H, insurance industry. The firm generates revenue mainly from subscriptions and product implementation services. Fineos help insurers streamline workflow, save costs, and win new business. Fineos is currently migrating customers to a cloud-based offering (from on-premise products). This makes it easier to rollout new features and support at lower marginal costs, while also providing more recurring subscription revenue. 

The firm executes a classic land and expand strategy. Building on its leadership in claims and absence products, Fineos aims to cross-sell its broader product set including payments, billing, data and more. It intends to expand the use of the Fineos platform across multiple jurisdictions with existing multinational clients. Higher customer expectations cost pressures, regulatory requirements, or increasing competition are prompting insurers to switch from clunky internal systems to external software like that from Fineos. 

There is ample room for Fineos to deploy new modules to existing customers and grow penetration over time. This further increases switching costs..Fineos has built multiple reference accounts from doing business with large insurers, who help with additional business wins. Risks include competition from larger competitors, and customer concentration, which may limit price hikes. These may be offset by Fineos’ high switching costs and the risk aversion of insurer clients in changing core systems. Fineos’ product switching costs are contingent on the group continuing to invest (such as in product development) to add value to customers.

Fineos Shares Remain Disconnected to Fair Value

Fineos had good top line growth in first-half fiscal 2022. Revenue grew 24% from the previous corresponding period, or pcp, to EUR 65 million. Morningstar analysts have lowered its fair value estimate to AUD 4.80 from AUD 5.10. But Fineos shares remain at a discount to Morningstar analysts estimate of intrinsic value. Morningstar analysts think the market is underpricing: 1) the inherent switching cost in Fineos’ products, stemming from the risk aversion of its customers to switching providers; and 2) the trend of insurers migrating their business administration processes to the cloud, providing opportunity for Fineos to take share. These drivers underscore Morningstar analysts expectation that Fineos will keep growing market share, noting around 55% of insurers still use legacy systems that have limited functionality and higher operating costs

Financial Strength

Fineos’ balance sheet is appropriately sound. As of Dec. 31, 2021, Fineos has cash and equivalents of EUR 48.6 million and no debt. But current earnings quality is weak. Cash flows have historically been maintained by equity raises, rather than from the ordinary course of business. Cash conversion (operating cash flows to EBITDA) has been irregular. Investing cash flows frequently outstrip operating cash flows due to constant reinvestments, such as for product development or acquisitions. Net cash should grow as the business scales. Morningstar analysts estimate Fineos can generate sustainable positive free cash flows by fiscal 2026-27. Until Fineos reaches scale, however, prospective business acquisitions over the next five years will likely require equity raises. Alternatively, FINEOS can drawdown debt for acquisitions, but this could result in gearing levels and debt coverage deteriorating quickly. Longer-term, we expect Fineos to realise operating leverage via a combination of revenue growth and the scaling of fixed costs. This should help maintain growth in earnings and help the firm become more cash generative. 

Bulls Say

  •  Fineos has low penetration in a sleepy industry that’s ripe for disruption. Operating metrics are solid and trending positively. 
  • Switching costs are high. A competitor who creates a better product only wins half the race. The other half is to build credible reference accounts and convince insurers to switch, which can be lengthy ordeals. 
  • Morningstar analysts believe Fineos will remain the leader in its niche space, as it continues to reinvest in its products or pursue acquisitions, bolstering its capabilities, increase the switching costs of its product suite and expand the modules on offer.

Company Profile

Fineos Corp Holdings PLC is an Irish company engaged in providing software solutions that include management and administration of policies and claims to the life, accident, and health insurance industry. The company’s platform, Fineos AdminSuite, comprises Fineos Absence, Fineos Billing, Fineos Claims, Fineos Payments, and Fineos Provider, among other solutions.

(Source: Morningstar)

General Advice Warning

Any advice/ information provided is general in nature only and does not take into account the personal financial situation, objectives or needs of any particular person.

Categories
Dividend Stocks

SUL reported strong 1H22 results reflecting sales of $1,705.1m

Investment Thesis 

  • Trading below our valuation and on attractive trading multiples and dividend yield. 
  • Strong tailwinds/fundamentals in SUL’s four core segments. For instance, sales for vehicle aftermarket continue to remain strong (with increase in second hand vehicle sales (Supercheap); travellers seeking social distancing and hence moving away from public transport (Supercheap); with Covid lockdown measures in forced, more people are spending their holidays domestically (BCF; macpac), utilising their vehicles (Supercheap); growing awareness of fit and healthy lifestyles (rebel).
  • Solid capital position.
  • Strong brands in BCF, macppac, rebel and Supercheap with solid industry positions in largely oligopolies and solid store network.
  • Transitioning to an omni-channel business. Whilst previously the business has been modelled on like-to-like store numbers, management now thinks of business metrics based on club members and has been able to grow the active club membership much faster than store numbers (store numbers in last 5 years have grown +2% CAGR vs active club members at +10% CAGR), providing it with an opportunity to expand customer base and therefore revenue base without significant capex for investment in stores (most of the customers are omni channel). Management continues to push towards expanding its online sales (Covid-19 added to this tailwind), with online sales penetration of ~13-15% of total sales currently and expected to reach 20-25% over the next 5 years.
  • Attractive loyalty members program, with over 8 million members. 

Key Risks

  • Rising competitive pressures.
  • Any issues with supply chain, especially as a result of the impact of Covid-19 on logistics, which affects earnings.
  • Rising cost pressures eroding margins (e.g., more brand or marketing investment required due to competitive pressures).
  • Disappointing earnings update or failing to achieve growth rates expected by the market could see the stock price significantly re-rate lower.

1H22 Results Highlights

Relative to the pcp: 

  • Sales of $1,705.1m was down -4.0% vs 1H21 but up +18.1% vs 1H20. 
  • Segment EBITDA of $329.4m was down -21.2% vs 1H21 but up +27.0% vs 1H20. 
  •  As a result of supply chain disruption, SUL’s gross margin of 46.7% was 100 bps below pcp but 170 bps above 1H20, driven by improved sourcing, pricing and tailoring the range of inventory, offset by higher freight and transport costs, growth in home delivery sales and some normalisation of promotional activity in 2Q22. 
  •  Normalised NPAT of $112.8m was down -35.8% vs 1H21 but up +60.9% vs 1H20 (Normalised EPS of 49.9 cents). 
  •  SUL was able to expand its store network, completing 15 new store openings and 28 refurbishments and relocations. 
  •  SUL maintains a conservative balance sheet with no bank debt and $94m cash balance. 
  • The Board declared a fully franked interim dividend of 27.0cps and reaffirmed its dividend policy to pay out total annual dividends of between 55% and 65% of underlying NPAT.

Company Profile

Super Retail Group (SUL) is one of Australasia’s Top 10 retailers. SUL comprises four core segments. (1) BCF: Australia’s largest outdoor retailer focused on selling Boating, Camping and Fishing products. (2) macpac:retailer of apparel and equipment with their own designs focused on outdoor adventurers. (3) rebel:retailer of branded sporting and leisure goods and equipment for casual and serious fitness enthusiast. (4) Supercheap Auto: specialty retail business which specialises in automotive parts and accessories.

(Source: Banyantree)

General Advice Warning

Any advice/ information provided is general in nature only and does not take into account the personal financial situation, objectives or needs of any particular person.

Categories
Technology Stocks

Megaport Ltd – Company achieved 2,455 customers across 768 Enabled Data Centres

Investment Thesis:

  • MP1 is a global Software Defined Network provider, focusing on cloud connectivity. As such, the Company is leveraged to the rapid growth of global cloud and data centres and is in a strong position to benefit from the rollout to new cloud and data centre regions. Key macro tailwinds behind MP1’s sector: (1) adoption of cloud by new enterprises; (2) increased level of investment and expenditure by existing customers; and (3) more and more enterprises looking to use multiple cloud products/providers, which works well with MP1’s business model.  
  • MP1 has a scale advantage over competitors. MP1 has over 600 locations around the globe. MP1 has significant scale advantage over competitors and whilst replicating this scale is not necessarily the difficult task, it will take several years to do so during which time MP1 will continue to add locations and customers using the scale advantage.
  • Strong R&D program ensuring MP1 remains ahead of competitors.
  • Strong cash balance of $104.6m. 
  • Strong relationship with data centres (DC). MP1 has equipment installed in 400 data centres, so MP1 is a customer of data centres. MP1 also drives DCs interconnection revenue. Whilst several data centres like NEXTDC, Equinix provide SDN (Software Defined Network) services, it is unlikely data centres will look to change their relationship with (or restrict) MP1 given they are designed to be neutral providers to network operators. Further, given MP1’s existing customer base and connections with cloud service providers, it would be very difficult for data centres (without significant disruption to customers/cloud service providers) to change the rules for MP1.

Key Risks:

  • High level of execution risk (especially with respect to development). 
  • Revenue, cost and product synergies fail to eventuate from the InnovoEdge acquisition. 
  • Heavy reliance on third party partners (especially data centre providers and cloud service providers). 
  • Data centres like NEXTDC, Equinix provide SDN services and decide to restrict MP1 in providing their services. 
  • Disappointing growth (in terms of expanding data centre footprint, customers, ports, Megaport Cloud Router).

Key highlights:

(1) Revenue increased +42% over pcp to $51.2m, driven by increased usage of services across all regions, with North America delivering strongest growth across all regions, increasing +55% over pcp, followed by Europe (+35% over pcp) and Asia Pacific (+28% over pcp). Monthly recurring revenue (MRR) increased +46% over pcp to $9.2m, driven by strong customer growth compounded with a 5% increase over pcp in services per customer. 

(2) Profit after direct costs improved +69.4% over pcp to $30.9m, driven by revenue growth and a controlled network cost. 

(3) Opex increased +42% over pcp with employee costs increasing +40% over pcp amid investment in headcount to support business growth (employee costs as a percentage of revenue declined -100bps over pcp to 55%), marketing (+126% over pcp) and travel (+1481% over pcp) costs increasing amid a gradual return of travel and conference activities following global easing of Covid-19 restrictions, and IT costs increasing +106% over pcp due to expensing of Software as a Service (SaaS) costs, previously capitalised, following a change in accounting policy. 

(4) The Company achieved 2,455 customers (up +7.4% over 2H21) across 768 Enabled Data Centres (420 located in North America, 208 in EMEA and 140 in Asia Pacific). 

(5) The Company ended the half with cash and equivalents position of $104.6m, down -23.2% over 2H21.

Company Description: 

Megaport Ltd (MP1) is a software-based elastic connectivity provider – that is, it is a global Network as a Service (NaaS) provider. MP1 develops an elastic connectivity platform providing customers interconnectivity and flexibility between other networks and cloud providers connected to the platform. 

(Source: Banyantree)

General Advice Warning

Any advice/ information provided is general in nature only and does not take into account the personal financial situation, objectives or needs of any particular person.

Categories
Shares Small Cap

Qube Working Towards Cost Effective Supply Chain

Business Strategy and Outlook

Qube’s strategy is to consolidate the fragmented logistics chain surrounding the export and import of containers, bulk products, automobiles, and general cargo, to create a more efficient and cost-effective supply chain. The business has enjoyed some successes to date, though significant scope for industry consolidation remains. 

It is alleged Qube to generate robust earnings growth over the long term on acquisitions, developments and organic growth. The domestic port logistics industry has traditionally been very fragmented, highly competitive, and inefficient. Currently, there are more than 250 operators providing port logistics services in one segment of the market. These are typically small operators with limited geographic scope offering limited point-to-point services. Qube’s strategy is to provide a broad range of services nationwide, touching multiple segments of the import/export supply chain. Analysts are supportive of this strategy and believe there is significant scope for further industry rationalisation. 

Consolidating the fragmented logistics chain should significantly improve Qube’s competitive position. Qube has already established a dominant market share in some specific port logistics offerings, particularly with regards to rail haulage services to and from Port Botany. Successfully developing its strategic land holdings into inland intermodal terminals should add materially to Qube’s future earnings and support cost advantages to less efficient peers. Qube aims to develop inland rail terminals as an alternative to moving container volumes from port via road. When fully developed, Moorebank will be Australia’s largest inland intermodal terminal. The bulk and general segments are highly fragmented and competitive but Qube is one of the largest players, with operations at 28 city and regional ports. The automotive stevedoring business operates in a duopoly market structure, holding long-term off-ship transportation, processing and storage contracts with major foreign vehicle manufacturers.

Financial Strength

Following the sale of Moorebank warehouses, Qube is in strong financial health. Gearing (net debt/net debt plus equity) was 10% in December 2021, well below Qube’s 30%-40% long-term target range. It has less than AUD 400 million in debt after receiving the upfront component of Moorebank sale proceeds, providing ample headroom to fund developments and bolt-on acquisitions. A special dividend or share buyback is likely in 2022. It is projected net debt/EBITDA to fall from 3.8 at June 2021 to below 2 times in 2022 and for the medium term. Qube’s businesses have delivered steadily increasing operating cash flow in recent years, though operations remain cyclical. Recent growth initiatives should generate strong future cash flow, though a large-scale acquisition or development project may require new equity funding. Qube has significant capital expenditure requirements including Moorebank development. Qube is committed to paying 50%-60% of earnings per share before amortisation as dividends.

Bulls Say’s

  • There is significant potential to increase efficiency through vertical integration of port logistics services. Qube will attempt to deliver on this strategy through consolidation and integration. 
  • The Moorebank Intermodal Terminal should become a key piece of Sydney’s transport infrastructure, driving strong returns for Qube. 
  • Senior management has a proven track record in the port logistics segment and has demonstrated an ability to generate strong returns for shareholders

Company Profile 

Qube has three main divisions: operating; property; and Patrick. Operating undertakes road/rail transportation of containers to and from port, operation of container parks, customs/quarantine services, warehousing, intermodal terminals, international freight forwarding, domestic stevedoring, and bulk transport. Patrick is the container terminals business acquired from Asciano, and the property division includes tactical land holdings in Sydney. 

(Source: MorningStar)

General Advice Warning

Any advice/ information provided is general in nature only and does not take into account the personal financial situation, objectives or needs of any particular person.

Categories
Technology Stocks

Microsoft remains well positioned to strengthen its market leadership in cloud computing

Investment Thesis:

  • Cloud products are growing at attractive growth rates as the Company continues to innovate. 
  • Exposure to the fast growing online gaming segment. 
  • New product release and updates to existing suite of products.
  • Solid free cash flow generation and strong balance sheet. 
  • Strong management team.  

Key Risks:

  • Competitive & macro pressures in key markets – if the growth rate for Azure slows the market would view this as a negative in our view.   
  • New product releases or updates fail to resonate with customers leading to product switching to competitors. 
  • U.S. trade war with China escalates, given MSFT uses parts from China.  
  • Value destructive acquisition(s). 
  • Adverse movements in currency (USD). 
  • Intellectual property theft and piracy.
  • There is significant optimism priced into MSFT’s share price (the stock is well owned by investors), and as such any disappointment on growth or strategic misstep could see the stock disproportionately de-rate lower.

Key highlights:

  • Driven by rising digital shift by enterprises, MSFT’s cloud growth continued to exceed management’s expectations (Intelligent cloud revenues came in at $18.3bn in 2Q22, up +26% YoY
  • Management also announced an extension of infrastructure to the 5G network edge. As the demand for cloud infrastructure services continues to surge in the post Covid-19 era, benefiting from organisations upgrading their legacy IT infrastructure and migrating to cloud-based workloads
  • Well positioned to strengthen its market leadership in cloud computing (as of FY21 MSFT’s cloud revenues grew at a higher rate than top player AMZN, with a 3-year average of +70% compared to +39.8% for AMZN), aided by growth in on-premise amid its large enterprise partner ecosystem
  • Public-cloud infrastructure, in-turn driving the overall margin expansion for the Company (large fixed costs should continue to get better diluted with the rapid increase in revenues, driving segment’s operating income at a higher rate than revenue). 
  • Management announced the acquisition of Activision Blizzard for $68.7bn. The acquisition remains the last piece in the puzzle for MSFT to exert dominance in Metaverse, with the Company now owning the hardware, cloud services and content to dominate gaming industry.

Company Description: 

Microsoft Corp (MSFT) develops, manufactures, licences, sells and supports software products. Microsoft offers operating system software, server application software, business and consumer applications software, software development tool and Intranet / Internet software. The Company has three main segments: (1) Productivity and Business Processes; (2) Intelligent Cloud; and (3) More Personal Computing.

(Source: Banyantree)

General Advice Warning

Any advice/ information provided is general in nature only and does not take into account the personal financial situation, objectives or needs of any particular person.

Categories
Dividend Stocks

Suncorp Group Ltd FY23 Plan, Dividend policy and Natural hazards & reinsurance

Investment Thesis:

  • Due to factors impacting both the achievement of the underlying ITR and cost to income targets, alongside the historically low interest rate environment, management believe it’s difficult to achieve a ROE target of 10% in FY21, however it seeks to maintain an ordinary dividend payout ratio of 60-80% of cash earnings.
  • SUN currently trades on a 2-yr forward PE-multiple of 15.1x and a fully franked yield of 5.0% – attractive. 
  • Share buyback of up to $250m should support its share price.
  • APRA allows advanced accreditation for SUN’s Bank resulting in capital relief.
  • Better than expected margin outcome in banking and general insurance (GI).
  • Positive industry changes from the Royal Commission recommendations. 
  • Continual strong credit quality for its Bank and Wealth segment whilst maintaining net interest margins.
  • Management can maintain an underlying insurance trading ratio of 12% consistently going forward and sustainable ROE of at least 10%.

Key Risks:

  • Greater than expected competition in lines of insurance affecting pricing, unit growth, and risk management.
  • Continuing elevated natural catastrophe occurrences such as the NSW bushfires, which will use up reinsurance and impact SUN’s earnings.
  • Not achieving key targets for FY21 such as the rollout of the Company’s technology and digital platforms.
  • Weaker than expected investment yields.
  • Lower net interest margins or higher provisions than expected.
  • Increased levels of claims.

Key highlights:

SUN saw Group NPAT decline -20.8% over pcp to $388m and cash earnings decline -29.1% over pcp to $361m primarily impacted by natural hazard claims costs of $695m ($205m more than expected) and investment market volatility, which saw the Group cut dividend by -11.5% over pcp to 23 Cash per share. GWP growth in Australia and NZ remained strong and the Group’s underlying ITR (excluding Covid-19 impacts) increased +60bps over 2H21 to 8.0% driven by the Consumer portfolio, with management continuing to guide towards the target of 10-12% in FY23.

Bank continued to make good progress on its strategic initiative, increasing lending by +2.2% over pcp and ending the half with a strong capital position.

  • Capital management:  (1) Completed a $250m on-market buyback, which is expected to improve EPS by +1.6%. (2) Maintained a strong capital position with CET1 at Group level of $492m (post buyback and final and special dividend payment), with both the GI Group and Bank CET1 ratios within their target operating ranges. (3) The Board declared a fully franked interim dividend of 23cps, equating to a pay-out ratio of 80% of cash earnings, at the top of the target pay-out range of 60-80%.
  • Insurance Australia:  PAT declined -55.8% over pcp to $114m, as strong top-line growth (GWP ex FSL up +5.1% over pcp to $4.5bn) and improved working claims performance was adversely impacted by adverse natural hazards experience (net incurred claims up +1.8% over pcp) and lower investment returns (down -98.7% over pcp to $4m). 
  • Banking & Wealth: (1) PAT rose +5.3% over pcp to $200m, driven by growth in loan balances (total lending up +2.2% over pcp driven by home lending partially offset by decline in business lending) and a net impairment release (release of $16m amid a $15m reduction in the Collective Provision due to the improvement in economic conditions), partly offset by a lower NIM (down -7bps over pcp to 1.97% due to reduced home lending margins from increased competition and movements in market rates, higher fixed rate home lending mix, partly offset by active management of customer deposits pricing) and increased expenses (up +1.1% over pcp leading to cost-to-income ratio increasing 110bps to 57.6%) to support strategic investment and volume growth. (2) Bank’s capital position remained strong with CET1 ratio of 9.91% (down -15bps over pcp), above the target operating range of 9-9.5%.  
  • NZ: PAT declined -34.9% over pcp to NZ$84m, primarily driven by a -22% decline in General Insurance PAT to NZ$78m as strong GWP growth (up +14% over pcp) was more than offset by adverse investment market impacts and elevated natural hazard experience (net incurred claims up +17.6% over pcp with natural hazard claims up +41.2% over pcp), and -79.3% over pcp decline in NZ Life Insurance PAT to NZ$6m.

Company Description:

Suncorp Group Ltd (SUN) provides general insurance, banking, life insurance, and superannuation products and related services to the retail, corporate, and commercial sectors in Australia and New Zealand. The company operates through Personal Insurance, Commercial Insurance, General Insurance New Zealand, and Banking segments.

(Source: Banyantree)

General Advice Warning

Any advice/ information provided is general in nature only and does not take into account the personal financial situation, objectives or needs of any particular person.

Categories
Funds Funds

Fidelity Sustainable Asia Equity Fund W-Accumulation (UK): Top Picks Among Asian Equity Offerings

Approach

This UK vehicle has formally adopted a sustainability mandate since April 2021. The investment process starts with hard exclusions, which contains firms with material exposure to weapons, tobacco, coal miners, and oil/gas extraction, among others. The exclusion list was further extended in 2021 to include oil/gas/ nuclear power utilities and firms that the team marked to have “deteriorating” ESG momentum within their sustainability rating framework, but it still accounted for less than 5% of the MSCI AC Asia ex Japan Index, and it hasn’t been seen  trigger any material changes to the portfolio over the past year. Dhananjay Phadnis has long favoured quality companies run by strong management teams that can demonstrate cinsistent value creation. It is considered the adoption of a sustainability framework a formalisation of the approach that he has already employed rather than a material change. Phadnis focuses on a firm’s competitive advantages, management quality, potential for improvement on ESG practice, and valuations in stock selection. The end portfolio consists of 50-70 names, which typically are fundamentally sound businesses trading below their intrinsic values and out-of-favour stocks with turnaround catalysts. Sector and country allocations are a residual of stock selection, though weights must stay within 10 percentage points of the index. Phadnis has done an excellent job extracting performance out of the strategy’s risk budget, and his investment savvy brings a further edge to the approach’s execution. Overall, the strategy maintains Process rating of High.

Portfolio

Dhananjay Phadnis increased the portfolio’s exposure to financials to 28.1% as of December 2021 from 19.3% a year ago, which represented a 9.4% overweighting compared with the MSCI AC Asia ex Japan Index. He added to AIA, despite it being a major underperformer in 2021. At Analysts’ January 2022 meeting, Phadnis remained positive on the insurer’s growth outlook, noting that it managed to expand its agent head count and branch out into new provinces in China when other Chinese insurers experienced difficulties in maintaining their agency force in 2021. Conversely, his conviction in Ping An Insurance waned given its slower-than-expected agency reform and its questionable decision of buying a majority stake in bankrupt Founder Group, and he has therefore exited his position. Meanwhile, the December 2021 portfolio continued to have an overweight position in information technology, where its 27.3% stake was above the index’s 25.8%. Phadnis liked SK Hynix, believing that the chipmaker’s acquisition of Intel’s NAND unit will enhance its competitiveness in the global memory market and that it has better corporate governance among Korean companies. Within consumer discretionary (16.1%), Phadnis initiated a stake in Meituan in July 2021 when its valuation became more compelling amid the regulatory crackdown. He believed the food delivery giant’s business model can adapt to new regulatory standards, noting its pricing power and efficient delivery network in the segment.

People

Dhananjay Phadnis brings 20 years of investment experience and has led this strategy’s UK and Luxembourg-domiciled vehicles since November 2013 and March 2015, respectively. He joined Fidelity in 2004 as an analyst and covered a variety of sectors before being promoted to portfolio manager in 2008. He has since posted excellent results across the single-country and regional mandates under his management, though he now focuses on this sustainable Asia equity strategy, which includes the USD 1.2 billion, Luxembourg-domiciled Fidelity Asian Equity fund that Phadnis took over from former manager Suranjan Mukherjee in August 2021. Phadnis had a total AUM of USD 6.1 billion as of December 2021. It is alleged Phadnis is one of the best Asian equity managers, who has consistently showcased astute investment savvy and a great passion for investing. Director of sustainable investing Flora Wang has been the strategy’s assistant portfolio manager since February 2021, when it formally adopted a sustainability mandate. Most of Wang’s contributions currently lie in the ESG integration front, including engaging with companies and identifying materiality issues. She is also gradually developing her fundamental stock-picking skills under Phadnis’ mentorship, and it is monitored how her role evolves. Phadnis is supported by Fidelity’s deep Asia Pacific ex Japan team of 58 analysts who average nine years of experience and six years with Fidelity. The team has showed greater stability since 2020 and has further grown with six additions in 2021 through September. Overall, the strategy continues to merit a People rating of High.

Performance 

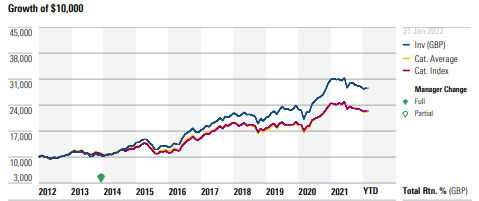
Lead manager Dhananjay Phadnis has delivered excellent results since he took over the UK-domiciled vehicle in November 2013. Through 31 Jan 2022, the W Acc share class returned 12.3% per year (in pound sterling), beating the MSCI AC Asia ex Japan Index’s 8.57% gain, the MSCI Emerging Markets Asia Index’s 8.86% gain, and 96% of its Asia ex Japan equity category peers. Its standard deviation was slightly higher than the indexes but in line with typical peers, resulting in robust risk-adjusted results. Indeed, the share class’ Sharpe ratio of 0.58 during the same period outpaced both indexes and 97% of peers. The outperformance was primarily driven by strong stock selection in China and India, with consumer discretionary, communication services, and financials contributing from a sector perspective. 

Phadnis’ quality bias and prudent risk management helped buoy the strategy’s relative performance in the 2021 down market. Although the W Acc share class lost 3.2% last year, it outperformed the MSCI AC Asia ex Japan Index by 64 basis points and ranked in the 48th percentile among peers. The vehicle primarily benefited from solid stock picks in the communication services and industrials sectors, with Bharti Airtel, NAVER, and Titan Wind Energy being some of the top contributors. The underweightings in Alibaba and Tencent and not owning Pinduoduo also helped, as they plunged on the back of heightened regulatory crackdowns in 2021. Conversely, stock picks in financials and healthcare detracted.

About Fund:

Fidelity International Limited is mainly owned by management and members of the Johnson family, who founded US-based Fidelity Investments. The entities have been separate since 1980, and though there are some similarities, in practice there is only limited alignment between the two. There were a number of personnel changes in 2018-19, including a change in CEO and the CIOs of equities, fixed-income, and multiasset, but the composition of senior management has been relatively stable since. More important, these changes do not seem to have negatively affected day-to-day investment activities, and on the whole, the initiatives undertaken by new management seem sensible.

(Source: Morningstar)

General Advice Warning

Any advice/ information provided is general in nature only and does not take into account the personal financial situation, objectives or needs of any particular person.