Categories
ETFs ETFs Research Sectors

iShares Core MSCI Total International Stock ETF: Access to the entire foreign market with low cost

IShares Core MSCI Total International Stock ETFs seek to track the investment result of an index  composed of large,  mid and small capitalization non US equities.

Approach

This fund earns a High Process Pillar rating for capturing the entire opportunity set available to its actively managed competitors in a cost-effective way. BlackRock’s portfolio managers track the MSCI ACWI ex USA Investable Market Index. This benchmark starts with all stocks listed outside of the United States and sorts them by their free-float-adjusted market cap. The final portfolio does not hold every stock in its benchmark index. Instead, the managers buy a representative sample of stocks to match index performance. They nearly fully replicate the large-cap segment and hold a portion of the smaller companies in the index. This reduces the need to trade smaller and less liquid names, which reduces transaction costs.

Portfolio

This fund captures the entire foreign-stock market. Its comprehensive portfolio effectively diversifies stock specific risk, with only 10% of assets in its 10 largest holdings. Sector weightings are comparable, with financials and industrial stocks collectively representing about one third of the portfolio. Country and regional allocations aren’t far off the category average, either. The fund does not hedge its currency risk, so its exposure to currencies like the euro, yen, and pound can add to its volatility. Stocks listed on emerging-markets exchanges account for a little more than 28% of this fund, while a typical competitor has a 10% stake. 

People

Industry-leading technology and BlackRock’s global footprint support a strong team of portfolio managers, earning an Above Average People Pillar rating. Alan Mason is head of portfolio management for the Americas and helps manage this portfolio. Rachel Aguirre was promoted to iShares head of product engineering in early 2021 and no longer serves as a manager on this fund. This change should not disrupt the fund’s ability to track its bogy because it retains its three remaining managers and much of their workflow is automated.
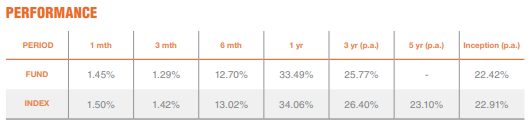
Performance

C:\Users\Akhila\Downloads\Screenshot 2021-12-08 130830.png

(Source: Factsheet)

Top holdings of the fund (%)

C:\Users\Akhila\Downloads\Screenshot 2021-12-08 top hold.png

About the fund

The fund tracks the MSCI ACWI ex USA Investable Market Index, which includes stocks of all sizes from foreign developed and emerging markets. It weighs them by market capitalization, an approach that benefits investors by capturing the market’s collective opinion of each stock’s value while keeping turnover low. Market-cap-weighting can be tough to beat because the market tends to do a good job valuing stocks over the long term. Its exceptional diversification mitigates the impact of holding the worst-performing names. It holds more than 4,300 stocks and has only 10% of assets in its 10 largest positions. The fund’s regional composition looks modestly different from the category average.

General Advice Warning

Any advice/ information provided is general in nature only and does not take into account the personal financial situation, objectives or needs of any particular person.

Categories
IPO Watch

Shriram Properties Limited opens up IPO on Wednesday,07, Dec,2021

The Shriram Properties IPO open date is Dec 8, 2021, and the close date is Dec 10, 2021. The issue may be listed on Dec 20, 2021.

This public issue comprises fresh issuance of equity shares worth Rs.250 crore and an offer for sale (OFS) of Rs.350 crore. The issue includes a reservation of equity shares worth Rs.3 crore for the company’s employees who will receive those shares at a discount of Rs.11 per share to final issue price. The company’s shares are expected to list on stock exchanges BSE and NSE.

The price brand for the IPO is Rs113-118 per equity share.  A retail-individual investor can apply for a minimum of 1 lot comprising 125  shares amounting to Rs.14,750 and maximum of 13 lots comprising 1625 shares amounting to Rs.1,91,750.

Objects of the Issue:

The IPO aims to utilize the net proceed towards the following purposes;

  • Repayment and/ or prepayment, in full or part, of certain borrowings availed by the company and its subsidiaries, Shriprop Structures, Global Entropolis and Bengal Shriram; and
  • General corporate purposes, subject to applicable laws.

About 75 per cent of the issue size has been reserved for qualified institutional buyers (QIBs), 15 per cent for non-institutional investors and the remaining 10 per cent for retail investors.

Axis Securities Ltd, ICICI Securities Ltd and Nomura Financial Advisory and Securities Ltd are the book running lead managers to the issue.

About the company

Incorporated in 2000, Shriram Properties is a part of the Shriram Group and is one of the leading residential real estate development companies in South India. The company primarily focuses on the mid-market and affordable housing segments. The company is also present in the mid-market premium and luxury housing categories as well as commercial and office space categories. Bengaluru and Chennai are the key markets for the company. The company also has operations in Coimbatore, Visakhapatnam, and Kolkata.

As of September 30, 2021, the company has completed 29 projects, out of which 24 are in the cities of Bengaluru and Chennai. As of September 30, 2021, the company has a total portfolio of 35 projects in ongoing, projects under development, and forthcoming projects, stages, aggregating to 46.72 million square feet of estimated saleable area.

(Source:   Shriram Properties IPO DRHP)

General Advice Warning

Any advice/ information provided is general in nature only and does not take into account the personal financial situation, objectives or needs of any particular person.

Categories
Funds Funds

Touchstone Flexible Income Fund Class Y: A flexible Income fund providing income as well as capital appreciation

Approach

The strategy’s primary hunting grounds include U.S. investment-grade and high-yield corporates, preferred stock, municipal bonds, and U.S. Treasuries. The strategy gains exposure to high-yielding corporate and municipal bonds via closedend funds–an uncommon tactic–which compose 5% to 15% of assets. Within these positions, the team focuses on the fund’s discount and quality of cash flow rather than its underlying holdings. Unlike most peers, the team doesn’t invest in emerging-markets debt, nor do they take on any currency risk. The strategy is benchmark-agnostic and flexible in its construction across asset classes and credit quality. It can invest up to 40% in junk-rated debt, which had peaked near 30% (including non-rated debt) up until September 2020. As of October 2021, the strategy’s non-investment grade exposure stands at 45%, owing to the increase in nonrated debt over the last year. The strategy tends to be concentrated; it is common to see individual positions between 2% and 4% each.

Portfolio

 The strategy continued to maintain a high allocation to preferred securities (34% of assets as of October 2021), followed by structured credit (32%, mostly in commercial mortgage-backed securities). The team modestly added shorter term Treasuries and maintained a nominal allocation to cash and cash equivalents towards the end of 2020 due to near zero interest rates. However, in the first quarter of 2021, the portfolio cut its 9% allocation to Treasuries to zero as the long-end of the curve sold off and no desirable returns were seen in the short-end. Post the first quarter of 2021, the portfolio’s exposure to treasuries, mostly short-dated, has increased drastically to 16% as of October 2021, owing to the flat credit curve and the credit spreads for riskier securities having tightened to pre-pandemic levels. The team has also reduced the exposure to corporate credits, both investment-grade (3.7%) and high yield (6.4%), given tight credit spreads. The portfolio’s exposure to nonrated debt has increased and stood at 30% as of October 2021, an increase of roughly 18 percentage points from last year. Most of this exposure comprises multifamily MBS originated by Freddie Mac, but still carry some risk.

Performance

 Institutional share class has shown middling performance within its nontraditional Morningstar Category peer group, returning 3.8% annualized. From November 2018 through November 2021, the strategy’s I share class has gained 6.5% annualized, outpacing more than 65% of its category peers, and beating its typical rival by 60 basis points. The team has made good use of its flexible mandate by tilting towards Treasuries and high-quality securitized credit heading into 2020 which helped ease some pain as the markets tumbled during the coronavirus-led self-off from Feb. 20 to March 23, 2020. However, the strategy’s 14.2% loss over that stretch was still in line with its peers. As markets recovered, the strategy gained a swift 25.3% from March 24, 2020, through to the end of the year, owing to the addition of battered corporate credits that rebounded later that year

(Source: Morningstar)

General Advice Warning

Any advice/ information provided is general in nature only and does not take into account the personal financial situation, objectives or needs of any particular person.

Categories
Funds Funds

Vanguard Mid-Cap Growth Fund Investor Shares: A Solid Mid-Cap Growth offering with rock bottoms fees

Approach

Frontier’s approach is best described as growth-at-a-reasonable-price. The team, like Wellington, also invests with a multi-year time horizon, though the end portfolio is more diversified, owning 70 to 80 stocks, while sector bets have stayed within 10 percentage points of the index over the years. Rounding out the subadvisor group is RS, which employs a sector-neutral approach to build a 60-80-stock portfolio. While risk management efforts–such as a desired 2:1 upside/downside ratio for each stock and the use of technical indicators–have proven efficacious on RS’ small-cap offering, they have consistently failed to have the intended impact in the mid-cap arena.

Portfolio

Portfolio’s sector weightings hover fairly close to the Russell Midcap Growth Index’s. As of June 2021, the biggest overweighting was to consumer discretionary, with 19% of assets, more than the Russell Midcap Growth Index’s 16%. The Wellington team purchased hospitality firm Hilton Worldwide Holdings in 2021’s second quarter, believing its asset light business model, good management team, and strong growth prospects in Asia will serve the stock well going forward. Conversely, the end fund held modest underweights to industrials and information technology.

portfolio vanguard.png

People

This strategy’s three subadvisors are experienced, stable, and capable, driving a People rating upgrade to Above Average from Average. The group has been more successful in the small-cap space over the years, and the standalone RS Mid Cap Growth offering has struggled since its July 2008 inception. In October 2021, Vanguard slashed RS’ stake to 20% from 45%. Frontier also came on board in December 2018 and manages 40% of fund assets (down from 45%). While the January 2020 retirement of Stephen Knightly was a loss, a thoughtful transition to Chris Scarpa–who had been a comanager since 2010–and the grooming of longtime analyst Ravi Dabas as comanager mitigate concerns.

Performance

The current subadvisors have been in place here together since December 2018. Since then, through October 2021, the fund’s 28.5% annualized gain lagged the Russell Midcap Growth Index’s 31.1% return and 60% of its mid-cap growth. Frontier Mid Cap Growth–the strategy behind Frontier’s sleeve–gained 30.6% annualized gross-of-fees between December 2018 and October 2021, slightly lagging the index but placing in line with peers. While stock selection was strong in financials, it was poor in healthcare, and the underweighting to the solidperforming information technology sector also detracted. 

Wellington–via its Focused Mid Cap Growth strategy–has been the strongest-performing subadvisor but long had had the lowest allocation, though Vanguard raised its stake to 40% of fund assets from 10% in October 2021. Between December 2018 and October 2021, its 31.8% annualized gain gross-of-fees bested 57% of peers. The sleeve benefitted from solid picks in I.T., including DocuSign and Square.

performance vanguard.png

(Source: MorningStar)

General Advice Warning

Any advice/ information provided is general in nature only and does not take into account the personal financial situation, objectives or needs of any particular person.

Categories
Shares Technology Stocks

ResMed witnesses strong revenue growth of 10%

Investment Thesis:

  • Global leader in a significantly under-penetrated sleep apnea market
  • High barriers to entry in establishing global distribution channels
  • Strong R&D program ensuring RMD remains ahead of competitors
  • Momentum in new masks releases
  • Bolt-on acquisitions to supplement organic growth 
  • Leveraged to a falling Australian dollar

Key Risks:

  • Disruptive technology leading to better patient compliance 
  • Product recall leading to reputational damage 
  • Competitive threats leading to market share loss
  • Disappointing growth (company and industry specific)
  • Adverse currency movements (AUD, EUR, USD)
  • RMD needs to grow to maintain its high PE trading multiple. Therefore, any impact on growth may put pressure on RMD’s valuation

Key highlights:

  • The net result was strong revenue growth of 10% for our ResMed business in the June quarter
  • In 4Q21, Revenue in the U.S., Canada, and Latin America (excluding Software as a Service), grew +18%, over the pcp, on demand for sleep devices and masks, including recovery of core sleep patient flow that was previously impacted by Covid-19 and increased demand following a recent product recall by one of RMD’s competitors, partially offset by lower Covid-19 related demand for RMD’s ventilators
  • Revenue in Europe, Asia, and other markets grew by 2% on a constant currency (CC) basis, on strong sales across RMD’s mask product portfolio, partially offset by weaker device sales due to the incremental Covid-19 respiratory care revenue in the pcp
  • Excluding the impact of the incremental respiratory care revenue associated with Covid19, revenue increased by 35% on a constant currency basis
  • Software as a Service revenue was +5% higher than the pcp, on continued growth in resupply service offerings and stabilising patient flow in out-of-hospital care settings

Company Description: 

ResMed Inc (RMD) develops, manufactures, and markets medical equipment for the treatment of sleep disordered breathing. The company sells diagnostic and treatment devices in various countries through its subsidiaries and independent distributors. RMD reports two main segments – Americas and Rest of the World (RoW) – with US its largest market. The company is listed on the Australian Stock Exchange (ASX) via CDIs (10:1 ratio).

(Source: Banyantree)

General Advice Warning

Any advice/ information provided is general in nature only and does not take into account the personal financial situation, objectives or needs of any particular person.

Categories
IPO Watch

Star Health and Allied Insurance Company IPO subscribed 79% on final day

The IPO comprises a fresh issue of equity shares worth Rs 2,000 crore and an offer-for-sale (OFS) of up to 58,324,225 equity shares of Rs. 5,249 crore by promoters and existing shareholders. The Star Health IPO opened at Nov 30, 2021, and closed at Dec 2, 2021and will list on both NSE & BSE at Dec 10, 2021.The minimum lot size comprises 16 shares at a price band of Rs.870 -900 per equity share. A retail-individual investor can apply for up to 13 lots.

The objective of the issue is to  to utilize the net proceed to augment the company’s capital base and insolvency level.  The proceeds will also be used for general corporate purposes.

The Star Health IPO has got 75 per cent reserved for qualified institutional buyers (QIBs) and 15 per cent reserved for non-institutional investors (NIIs). The remaining 10 percent of the issue is available for retail investors.

Star Health IPO Subscription Status

Star Health IPO opened for subscription on Tuesday, November 30,2021 and concluded at 5 p.m Thursday , December 2,2021.

According to the data available on the BSE, Star Health was met with a muted response as it got subscribed 79 percent on the final day.

The shares which are to be allocated for the qualified institutional buyers (QIBs) was subscribed 1.03 times, while those of non institutional investors was subscribed 0.19 times and that of retail individual investors (RIIs) was subscribed 1.10 times. Separately, shares for the employees’ segment was subscribed 0.10 times, the data showed.

About the Company

Incorporated in 2006, Star Health and Allied Insurance Company Ltd is one of the largest private health insurers in India with a market share of 15.8% in Fiscal 2021. The company primarily focuses on the retail health and group health segments which accounted for 89.3% and 10.7% of the company’s total GWP in Fiscal 2021 respectively.

The company mainly distributes policies through individual agents and also includes corporate agent banks and other corporate agents. As of Sep 31, 2021, its network distribution includes 779 health insurance branches across 25 states and 5 union territories in India. Star Health has also built one of the largest health insurance hospital networks in India with more than 11,778 hospitals.

(Source:https://www.sebi.gov.in/filings/public-issues/jul-2021/star-health-and-allied-insurance-company-limited-drhp_51323.html)

General Advice Warning

Any advice/ information provided is general in nature only and does not take into account the personal financial situation, objectives or needs of any particular person.

Categories
Global stocks Shares

Strong customer retention and new business growth drives QBE earnings higher

Investment Thesis:

  • New CEO announced could bring a fresh perspective and potential rebasing of earnings. 
  • As a global insurer, QBE’s operations are much more diversified than domestic peers which means insurance risk is more spread out. 
  • Solid global reinsurance program should insulate earnings from catastrophe claims. 
  • Expected prolonged period of lower interest rates (which does not benefit QBE’s investment portfolio). 
  • Committed to the share buyback program. 
  • Undertook a simplification process and sold non-core operations.

Key Risks:

  • Prolonged period of pricing pressures. 
  • Adverse CAT claims. 
  • Ongoing prolonged period low interest rates and volatility in credit spreads which affects QBE’s predominately defensive portfolio. 
  • As a global insurer, QBE’s operations are much more diversified than domestic peers which means insurance risk is more spread out. However, at the same time, as it underwrites across the globe, the business it is more difficult to forecast and analyse claims and pricing environment as well as reinsurance.
  • Undesirable investment returns below management guidance. 
  • Prolonged poor performances in Asia

Key highlights:

  • QBE delivered 1H21 net income of $441m (vs loss of $712m y/y) as QBE continued to post solid premium rate increases (average group-wide rate increases averaged +9.7%) across all segments, as well as strong customer retention and new business growth.
  • However, management warned rate momentum is showing signs of moderating in some geographies and products, particularly in International Markets.
  • QBE’s operational efficiency program saw expense ratio improve -60bps over pcp to 13.7%. Balance sheet remained strong with gearing improving to 31.1%.
  • The Board declared an interim dividend of 11cps (up +175% over pcp) and guided to typically higher catastrophe incidence and Crop result variability in 2H21.
  • QBE saw expense ratio improve -60bps over pcp to 13.7%, with management announcing its next phase of efficiency program (focused on IT modernisation and digitisation) remains on track to deliver an expense ratio of 13% by 2023, anticipating a restructuring charge of $150m to be expensed over three years (of which $29m was recognised in 1H21).
  • Gross written premium increased +20% to $10,203m reflecting the strong premium rate environment

Company Description: 

QBE Insurance Group Ltd (QBE) is a global general insurer that underwrites commercial and personal policies across North America, Australia and New Zealand, Europe and emerging markets. QBE’s Equator Re segment is its captive reinsurer, providing reinsurance protection to the entire Group’s operating divisions.

(Source: Banyantree)

General Advice Warning

Any advice/ information provided is general in nature only and does not take into account the personal financial situation, objectives or needs of any particular person.

Categories
ETFs ETFs

SPDR® Dow Jones Global Real Estate Fund: Well-diversified exposure to global real estate at a relatively cheap price

SPDR Dow Jones Real Estate ETF DJRE is a sensible option for investors seeking exposure to diversified global real estate. DJRE tracks the Dow Jones Global Select Real Estate Securities Index, a market-cap-weighted index (rebalanced quarterly) via full replication.

Approach

DJRE aims to fully replicate the Dow Jones Global Select Real Estate Securities Index. Stocks included in the index must derive 75% of revenue from owning and operating properties, have a market cap of at least USD 200 million at the time of inclusion, and meet certain liquidity requirements. In simple terms, companies in this index generate most of their revenue from rent.

Portfolio 

Real estate investment trusts make up about 85% of the portfolio while approximately 10% of DJRE’s holdings are property developers and non-REIT property managers. The US continues to dominate the portfolio, forming more than 65% of regional exposure in October 2021. Other sizable weightings include 10.2% in Japan, 4.6% in Australia, 4.5% in the United Kingdom, and 3% in Singapore. The remainder is in Hong Kong and developed European markets such as Germany, France, and Sweden.

People

John Tucker has been appointed as the new chief investment officer, Effectively from September 2021, replacing Lynn Blake, who has taken retirement. Tucker is a State Street veteran who has been in multiple senior leadership roles within GEBS for the past 20 years. Australia-domiciled passive products are managed by a core team of Tucker and four portfolio managers: Alexander King, Lillian Poon, Andrew Howson, and Elda Dong.

Performance

C:\Users\Akhila\Downloads\etf per. 2.png

(Source: Factsheet)

Top holdings of the fund

C:\Users\Akhila\Downloads\top 10 holdings.png

(Source: Factsheet)

About the fund

SPDR Dow Jones Real Estate ETF DJRE is a sensible option for investors seeking exposure to diversified global real estate. DJRE tracks the Dow Jones Global Select Real Estate Securities Index, a market-cap-weighted index (rebalanced quarterly) via full replication. The fund derives strong support from the global reach and execution capabilities of its parent State Street. With around 250 total holdings and less than 30% exposure in the top 10 holdings, the target benchmark is well diversified. The index consists of globally traded real estate investment trusts and real estate operating companies–companies generating most of their revenue from rent

(Source: Morningstar)

General Advice Warning

Any advice/ information provided is general in nature only and does not take into account the personal financial situation, objectives or needs of any particular person.

Categories
Shares Technology Stocks

Xero Ltd. delivered strong results with improving key metrics

Investment Thesis:

  • Competent leadership team with a proven track record of delivering strong growth (Strong top-line momentum driven by strong support of accountants and bookkeepers with annualised monthly recurring revenue increasing at CAGR 32% and strong subscriber growth with positive LTV (Lifetime Value) trends (over FY15-19, ANZ LTV grew at CAGR 48% and International LTV grew at CAGR 65%)). 
  • Solid product offering that is secure, scalable and efficient technology which is competing against competitors with technology that has legacy issues. We note that XRO’s small business platform is an ecosystem of more than 700 connected apps backed by a community of more than 50,000 users of XRO’s API developer tools. Going forward the Company could potentially increase its revenue by monetising its platform in other ways like charging third party app developers. 
  • Potential for meaningful acquisitions to fill gaps in product capability. In our view, the Company is well positioned to make acquisitions going forward (given its balance sheet and funding status). 
  • The Company continues to focus on cloud accounting, and we see significant upside potential in the sector given the fact that the current levels of small business cloud accounting adoption globally is estimated to be less than 20% of the total market or opportunity across English-speaking countries in which the Company operates.

Key Risks:

  • Decrease of migration to cloud software. 
  • Currency headwinds due to weakening of NZ$ relative to AUD, USD and Pound. 
  • Deteriorating sentiment if the economy and IT spending weakens. 
  • Excessive competition from other established players like Intuit leading to loss of market share. 
  • Inability to extract higher operational efficiencies as the Company scales up. 
  • Issues in gaining market share especially in markets with established incumbents.

Key highlights:

  • Improving trends in key metrics – (1) subscriber growth; (2) higher ARPUs (average revenue per user); and (3) lower churn.
  • A key catalyst for XRO’s share price going forward will be execution and growth in North America. 
  • Despite relatively mature markets in New Zealand and Australia, XRO’s subscriber growth in 1H22 in both markets (NZ +16% and Aus +22%) was a standout from our perspective.
  • The Company finished 1H22 with net cash position of NZ$125m and has total available liquidity of NZ$1.2bn.
  • Operating revenue was up +23% (or up +26% in constant currency) to NZ$505.7m, with total subscribers up +23% to 3.0m and ARPU (average revenue per user) up +5% to NZ$31.32
  • The financial position for different markets of Xero are as follows:
  • Australia: Segment revenue was up +22% to NZ$225m, with net additions up +24% and subscribers up +22% to 1.24m. 
  • New Zealand: Segment revenue was up +13% to NZ$72m, with net additions up +55% and subscribers up +16% to 480,000. 
  • United Kingdom: Segment revenue was up +33% to NZ$133m, with net additions up +160% and subscribers up +23% to 785,000. 
  • North America: Segment revenue was up +5% to NZ$30m, with net additions up +130% and subscribers up +23% to 308,000. 
  • Rest of World: Segment revenue was up +72% to NZ$46m. with net additions up +136% and subscribers up +48% to 201,000.

Company Description: 

Xero Ltd (XRO) is a software as a service (SaaS) company, engaged in the provision of a platform for online accounting and business services to small businesses and their advisors. The Company operates through two operating segments: Australia and New Zealand (ANZ), and International (UK + North America + Rest of the World).

(Source: Banyantree)

General Advice Warning

Any advice/ information provided is general in nature only and does not take into account the personal financial situation, objectives or needs of any particular person.

Categories
ETFs ETFs

Betashares Global Sustainability Leaders ETF: ESG – Oriented global equities exposure with a distinctive returns Profile

Approach

ETHI tracks the Nasdaq Future Global Sustainable Leaders Index, a benchmark co-developed with BetaShares in November 2016. ETHI comprises 200 stocks that have above-average ESG characteristics. It uses a float-adjusted market-cap-weighted approach, starting with a universe of 6,000 stocks listed in North America, Europe, or Asia (ex-Australia). By adding ESG considerations, the index differs markedly from other passive and ESG indexes. A carbon screen identifies companies that lead in terms of carbon efficiency; these tend to be in the top one third of their industry for carbon efficiency. A minimum of five Scope 4 leaders is required in the index. A market cap and developed markets screen cuts the investable list to under 500. Analysts then perform negative screens until the 200-name portfolio is left.

Portfolio

A change in April 2020 has led to the portfolio providing exposure to the largest 200 global ex-AUS stocks by capitalisation that are considered climate change leaders. Further they must not be materially engaged in activities deemed inconsistent with responsible investment considerations. Stocks must have a market cap of more than USD 3 billion and three month trading volume of over USD 1 million. The index differs largely from other passive and active indexes with sector skews to healthcare, consumer cyclicals, financials and technology.

Top 10 Holdings

CompanyWeighting (%)
NIVDIA Crop 6.0%
Apple Inc. 4.3%
Home Depot3.8%
Visa Inc.3.4%
Adobe Inc.2.8%
Mastercard Inc.2.8%
ASML Holding NV2.7%
PayPal Holdings 2.6%
Toyota Motor Corp.2.3%
Cisco Systems Inc.2.3%
Sector Allocation.png

People

Nguyen was an equity analyst at Three Pillars Portfolio Managers, where his responsibilities included systems development, risk management, and securities analysis. The committee comprises Betashares co-founder David Nathanson and Adam Verwey, a managing director of large investor Future Super. In September 2020, Simon Sheikh stood down and was replaced with Kylie Charlton, managing director of Australian Impact Investments.

Performance

However, from its Feb. 21, 2020, peak the strategy actually fell 22.74% to March 23, 2020. Since then, the strategy has made a remarkable turnaround. ETHI closed the calendar year 2020 with a n absolute return of 24.94%. The rally continued into 2021 and as of Sept. 30, 2021, the fund’s returns for the calendar year are 20.85%.The fund has remained within the 15-basis-point tracking error and the bid/offer spread was indicated to have remained below 30 basis points, averaging around 20 basis points.

Performance.png

About the Fund

ETHI aims to track the performance of an index (before fees and expenses) that includes a portfolio of large global stocks identified as “Climate Leaders” that have also passed screens to exclude companies with direct or significant exposure to fossil fuels or engaged in activities deemed inconsistent with responsible investment considerations.

(Source: MorningStar)

General Advice Warning

Any advice/ information provided is general in nature only and does not take into account the personal financial situation, objectives or needs of any particular person.