Categories
Funds Funds

BNY Mellon Global Stock Fund: A solid strategy led by an impressive, long-tenured team

Process:

The Walter Scott investment team executes a patient investment process, undertaking rigorous fundamental research to identify quality names that can deliver superior long-term returns. It earns an Above Average Process rating. The process starts with an initial screen of businesses that can deliver at least 20% cash flow return on investment over a full market cycle. The managers have an active watchlist of approximately 250 companies they closely monitor, and the team undertakes fundamental bottom-up analysis, assessing factors such as competitive position, industry dynamics, profitability, balance-sheet strength, financial model, and quality of management. 
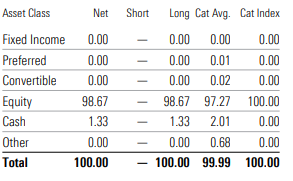
Portfolio:

The team constructs a relatively concentrated portfolio that usually has 40-60 names. Adequate diversification is maintained by limiting position sizes to a maximum of 5 percentage points, but typically they don’t exceed 4% of the portfolio. The group’s long-term quality focus results in the strategy exhibiting a bias toward mega-cap stocks, though it does hold some mid-cap names. Historically, the strategy has exhibited significant country-level bets. It is typically underweighted in the United States relative to the MSCI World Index. At the sector level, the strategy favours tech, healthcare, and consumer cyclical stocks, while having a large underweighting in financial services.

People:

An experienced, stable team that works together well leads to a High People rating. Investment decision-making at subadvisor Walter Scott is team-based. All investments, new and existing, are discussed and debated until there is unanimous agreement by the research team. Stability and experience characterize Walter Scott’s investment team, with members boasting impressive experience and tenures with the firm. More than half of the investment team members have spent their entire investment careers at the company. In 2021, one of the joint portfolio managers, Yuanli Chen, left, a rare departure. Long-term cohead of research Alan Edington moved to a new position, Responsible Investment.

Performance:

The strategy has sported strong results from its late-December 2006 launch through 2021. The I shares’ 9.4% annualized gain exceeded its MSCI World Index prospectus benchmark’s 7.4% and edged the typical world large-stock growth peer. However, it’s lost a bit of an edge against a more growth-oriented benchmark, with the MSCI World Growth Index up 10% annualized during the period.

(Source: Morningstar)

Price:

Analysts find it difficult to analyse expenses since it comes directly from the returns. Analysts expect that it would be able to deliver positive alpha relative to its category benchmark index.


(Source: Morningstar)                                                                     (Source: Morningstar)

About Funds:

With a focus on investing for the long term, the portfolio consistently favors technology, healthcare, and consumer discretionary names while being significantly underweight in financial services and energy. The strategy won’t always lead the way in buoyant markets. It landed behind the MSCI World Index benchmark in 2021. The investment seeks long-term total return. To pursue its goal, the fund normally invests at least 80% of its net assets, plus any borrowings for investment purposes, in stocks. The fund’s investments will be focused on companies located in the developed markets. Examples of “developed markets” are the United States, Canada, Japan, Australia, Hong Kong and Western Europe. It may invest in the securities of companies of any market capitalization. The fund’s sub-investment adviser, Walter Scott & Partners Limited (Walter Scott), seeks investment opportunities in companies with fundamental strengths that indicate the potential for sustainable growth.

(Source: Morningstar)

General Advice Warning

Any advice/ information provided is general in nature only and does not take into account the personal financial situation, objectives or needs of any particular person.

Categories
Global stocks Shares

Dollar Tree’s Price Hike Should Help, but Long-Term Competition Remains a Concern

Business Strategy and Outlook:

Dollar Tree’s namesake banner has a long history of strong performance, enabled by its differentiated value proposition, but, before the pandemic, its Family Dollar unit (acquired in 2015) struggled to generate top-line and margin growth. Dollar Tree banner is better positioned long-term, but do not believe the aggregated firm benefits from a durable competitive edge, as competitive pressure in a fast-changing retail environment amid minimal switching costs limits results.

Accounting for around half of sales, the Dollar Tree banner’s wide assortment of products at $1.25 or less has appealed to customers, drawing a broad range of low to middle-income consumers. We believe the concept has room to grow (with square footage rising by a low- to mid-single-digit percentage long term), expanding in new markets while also increasing density. The chain’s fast-changing assortment creates a treasure hunt experience that has a history of drawing customers (posting nearly 3% same-store sales growth on average over the past five years) and has been hard for online retailers to match.

Financial Strength:

Though it took on considerable debt to fund its 2015 purchase of Family Dollar, Dollar Tree’s leverage-reduction efforts have left it on sound financial footing. Its strong balance sheet and free cash flow generation should suffice to fund growth and investments necessary to maintain low price points and respond to competitive pressure. The firm ended fiscal 2020 with net debt at less than three-quarters adjusted EBITDA, the latter of which covered interest expense more than 17 times. Furthermore, capital expenditures to fuel store growth are fairly discretionary, so Dollar Tree should be able to curb targets if needed in the event of financial strain.

Bulls Say:

  • Dollar Tree’s $1.25 price point concept is differentiated, holding absolute dollar costs low for customers while allowing the retailer to realize higher margins than conventional retailers. 
  • Small ticket sizes make it difficult for online retailers to contend with Dollar Tree’s single-price-point model as shipping costs weigh on their ability to compete profitably. 
  • As its two banners become more closely integrated and the store network expands, Dollar Tree should leverage its supply chain and distribution infrastructure investments, generating resources to fuel its low-price model.

Company Profile:

Dollar Tree operates discount stores in the U.S. and Canada, including over 7,800 shops under both its namesake and Family Dollar units (nearly 15,700 in total). The eponymous chain features branded and private-label goods, generally at a $1.25 price. Nearly 50% of Dollar Tree stores’ fiscal 2020 sales came from consumables (including food, health and beauty, and household paper and cleaning products), just over 45% from variety items (including toys and housewares), and 5% from seasonal goods. Family Dollar features branded and private-label goods at prices generally ranging from $1 to $10, with over 76% of fiscal 2020 sales from consumables, 9% from seasonal/electronic items (including prepaid phones and toys), 9% from home products, and 6% from apparel and accessories.

(Source: Morningstar)

General Advice Warning

Any advice/ information provided is general in nature only and does not take into account the personal financial situation, objectives or needs of any particular person.

Categories
Technology Stocks

We Like Intel’s Appointment of Micron CFO Dave Zinsner as its New CFO; No Change to FVE

Business Strategy and outlook

Intel is the leader in the integrated design and manufacturing of microprocessors found in PCs and servers. Intel historically differentiated itself first and foremost via the execution of Moore’s law, which predicts transistor density on integrated circuits will double about every two years, meaning subsequent chips have substantial power, cost, and size improvements. This scaling advantage was perpetuated through higher-than-peer-average R&D and capital expenditure budget that allows it to control the entire design and manufacturing process in an industry .

As cloud computing continues to garner significant investment, Intel’s data center group will be an indirect beneficiary. Mobile devices have become the preferred device to perform computing tasks and access data via cloud infrastructures that require large-scale server build-outs. This development has provided strong tailwinds for Intel’s lucrative server processor business. Morningstar analyst believe Intel will experience continued growth in the data center, though we note competition from AMD and customers designing their own ARM-based silicon are potent risks.

The proliferation of mobile devices has come at the expense of the mature PC market, Intel’s historic stronghold, with ARM and its cohorts joining AMD as chief rivals. The rise of artificial intelligence has also unleashed a new competitor in Nvidia for specialized chips to accelerate AI-related workloads. Consequently, Intel has built a broad accelerator portfolio via the acquisition of Altera for FPGAs, Mobileye for computer vision chips used in cars, and Habana Labs for AI chips.

We Like Intel’s Appointment of Micron CFO Dave Zinsner as its New CFO; No Change to FVE

On Jan. 10, Intel announced it appointed David Zinsner as CFO, thus filling the vacancy created by current CFO George Davis’s planned retirement in May 2022. Morningstar analyst think that Zinsner is the right CFO to manage this lofty spending budget, as Micron has successfully executed its new technology ramps on an average capex of $9.2 billion over the past four years. Morningstar analyst  are maintaining our $65 fair value estimate for wide-moat Intel; shares appear undervalued and present an attractive buying opportunity for long-term, patient investors.

Financial Strength

Intel typically operates with ample liquid cash reserves. At the end of 2020, the firm held about $36.4 billion in total debt and nearly $24 billion in cash and cash equivalents, short-term investments, and trading assets. Morningstar analyst expects the firm generates sufficient cash flow and has ample resources to meet its debt obligations, capital expenditure requirements, potential acquisitions, and shareholder returns. 

Bulls Say 

  • Intel is one of the largest semiconductor companies in the world and holds the lion’s share of the PC and server processor markets. The firm has sustained its position at the forefront of technology by investing heavily in R&D, and this trend should continue. 
  • Intel has made a string of savvy acquisitions to build its Artificial Intelligence and automotive offerings, including Altera, Mobileye, Habana Labs, and Movidius. 
  • The data center group has indirectly benefited from the proliferation of mobile devices. Server processor sales will be the main driver of growth in the near future

Company Profile

Intel typically operates with ample liquid cash reserves, which we believe is justified as an offset to the semiconductor industry’s cyclical nature in general and Intel’s higher capital intensity in particular. At the end of 2020, the firm held about $36.4 billion in total debt and nearly $24 billion in cash and cash equivalents, short-term investments, and trading assets. We think the firm generates sufficient cash flow and has ample resources to meet its debt obligations, capital expenditure requirements, potential acquisitions, and shareholder returns.Intel’s dominant manufacturing operations require massive capital outlays for expensive equipment, fab construction, and the maintenance of a clean room environment. Morningstar analyst estimates utilize historical patterns and the expected progression of Moore’s law to attain an average annual capital expenditure of $14 billion over the next five years. Of this outlay, 70% is for maintaining existing capacity, with the remainder used for process development for the 7-nanometer process node and beyond.

 (Source: Morning Star)

General Advice Warning

Any advice/ information provided is general in nature only and does not take into account the personal financial situation, objectives or needs of any particular person.

Categories
Global stocks

Dollar Tree Inc: Distinguished by its $1.25 price point concept

Business Strategy and Outlook

Dollar Tree’s namesake banner has a long history of strong performance, enabled by its differentiated value proposition, but, before the pandemic, its Family Dollar unit (acquired in 2015) struggled to generate top-line and margin growth. It is suspected the Dollar Tree banner is better positioned long-term, but do not believe the aggregated firm benefits from a durable competitive edge, as competitive pressure in a fast-changing retail environment amid minimal switching costs limits results. We expect the pandemic’s effects to be confined to the near term, leaving the long-term competitive dynamic intact. 

Accounting for around half of sales, the Dollar Tree banner’s wide assortment of products at $1.25 or less has appealed to customers, drawing a broad range of low to middle-income consumers. The concept has room to grow (with square footage rising by a low- to mid-single-digit percentage long term), expanding in new markets while also increasing density. The chain’s fast-changing assortment creates a treasure hunt experience that has a history of drawing customers (posting nearly 3% same-store sales growth on average over the past five years) and has been hard for online retailers to match. With basket sizes small and the average transaction resulting in a modest bill, we consider the segment relatively well insulated from the digital threat. 

Prospects are murkier at Family Dollar, which has struggled since its acquisition, though the pandemic has provided a fleeting sales lift. Evenly distributed between urban and rural areas, it is anticipated that the chain’s presence in cities is especially susceptible to competitive pressures from a bevy of convenience stores, mass merchandisers, and grocers. While its mix of low prices and convenience carries appeal, particularly among customers that do not have nearby alternatives, It is expected that the benefits of operational improvements and tighter integration with Dollar Tree will largely be offset by competitive strain.

Despite the headwinds, both chains should deliver long-term top-line and margin growth in aggregate, capitalizing on consumers’ desire for convenience and value even as the landscape becomes more challenging.

Financial Strength

Though it took on considerable debt to fund its 2015 purchase of Family Dollar, Dollar Tree’s leverage-reduction efforts have left it on sound financial footing, in our view. Its strong balance sheet and free cash flow generation should suffice to fund growth and investments necessary to maintain low price points and respond to competitive pressure. With the stores remaining open and catering to essentials, we expect little difficulty with navigating the challenges presented by the pandemic. The firm ended fiscal 2020 with net debt at less than three-quarters adjusted EBITDA, the latter of which covered interest expense more than 17 times, neither mark troubling. Despite aggressive growth in the Dollar Tree banner (from under 4,000 stores at the start of fiscal 2010 to more than 7,800 at the end of fiscal 2020) and performance improvement investments at Family Dollar, cash generation has been strong. It is expected to have free cash flow to the firm to average 5% of sales over our explicit forecast. Furthermore, capital expenditures to fuel store growth are discretionary, so Dollar Tree should be able to curb targets if needed in the event of financial strain. Annual outlays to average 3%-4% of sales over the next decade, or just over $1 billion. We do not anticipate Dollar Tree will introduce a dividend. Instead, we expect it to direct excess funds to share repurchases, consistent with its practice before the Family Dollar purchase (the firm bought back an average of just under $500 million in shares annually from fiscal 2010 to 2014, adding $200 million in fiscal 2019 and $400 million in fiscal 2020). In the long term, we assume the company uses around 60% of its cash flow from operations to buy shares.

Bulls Say’s

  • Dollar Tree’s $1.25 price point concept is differentiated, holding absolute dollar costs low for customers while allowing the retailer to realize higher margins than conventional retailers. 
  • Small ticket sizes make it difficult for online retailers to contend with Dollar Tree’s single-price-point model as shipping costs weigh on their ability to compete profitably. 
  • As its two banners become more closely integrated and the store network expands, Dollar Tree should leverage its supply chain and distribution infrastructure investments, generating resources to fuel its low-price model.

Company Profile 

Dollar Tree operates discount stores in the U.S. and Canada, including over 7,800 shops under both its namesake and Family Dollar units (nearly 15,700 in total). The eponymous chain features branded and private-label goods, generally at a $1.25 price. Nearly 50% of Dollar Tree stores’ fiscal 2020 sales came from consumables (including food, health and beauty, and household paper and cleaning products), just over 45% from variety items (including toys and housewares), and 5% from seasonal goods. Family Dollar features branded and private-label goods at prices generally ranging from $1 to $10, with over 76% of fiscal 2020 sales from consumables, 9% from seasonal/electronic items (including prepaid phones and toys), 9% from home products, and 6% from apparel and accessories.

(Source: MorningStar)

General Advice Warning

Any advice/ information provided is general in nature only and does not take into account the personal financial situation, objectives or needs of any particular person.

Categories
Global stocks Shares

Nike’s Powerful Brand and E-Commerce Position It Well Despite Some Short-Term Issues

Business Strategy and Outlook

We view Nike as the leader of the athletic apparel market and believe it will overcome the challenge of COVID-19 despite near-term supply issues. Morningstar analyst think Nike’s strategies allow it to maintain its leadership position. In mid-2017, Nike announced a consumer-focused realignment. It is investing in its direct-to-consumer network while reducing the number of retail partners that carry its product. In North America and elsewhere, the firm is reducing its exposure to undifferentiated retailers while increasing distribution through a small number of retailers that bring the Nike brand closer to consumers, carry a full range of products, and allow it to control the brand message. Nike’s consumer plan is led by its Triple Double strategy to double innovation, speed, and direct connections to consumers. Triple Double includes cutting product creation times in half, increasing membership in Nike’s mobile apps, and improving the selection of key franchises while reducing its styles by 25%. We think these strategies will allow Nike to hold share and pricing.

Although its recent results in China have been inconsistent due to supply issues and a political controversy, Morningstar analyst still believe Nike has a great opportunity for growth there and in other emerging markets. Moreover, with worldwide distribution and huge e-commerce that totaled about $9.3 billion in fiscal 2021, Nike should benefit as more people in China, Latin America, and other developing regions move into the middle class and gain broadband access.

Financial Strength

 Nike is in excellent financial shape to weather the COVID-19 crisis. At the end of fiscal 2021’s second quarter, Nike had $9.4 billion in long-term debt but $15.1 billion in cash and short-term investments.Nike does not have any long-term debt maturities until May 1, 2023, when its $500 million in 2.25% senior unsecured debt matures, but it does have significant endorsement commitments that, as of the end of fiscal 2021, totaled at least $5.5 billion over the ensuing five fiscal years. The firm produced nearly $19 billion in free cash flow to equity over the past five years, and Morningstar anlayst estimate it will generate more than $38 billion in free cash flow to equity over the next five. Nike issued $1.6 billion in dividends in fiscal 2021 and analyst forecast an average annual dividend payout ratio of about 30% over the next decade. Over the next five fiscal years, Morningstar analyst forecast that Nike will repurchase about $19 billion in stock and issue $11 billion in dividends. 

Bull Says

  • Nike has a great opportunity in fast-growing markets like China. More than 70% of Nike’s growth over the next five years may come from outside North America. 
  • Nike’s Triple Double strategy of increased innovation, direct-to-consumer sales, and speed may improve margins and share. Membership growth in its digital channel has exceeded expectations. 
  • Nike’s gross margins may expand by a couple dozen basis points per year through automation, ecommerce, and higher prices. Nike is actively shifting sales to differentiated retail in North America to increase full-priced sales

Company Profile

Nike is the largest athletic footwear and apparel brand in the world. It designs, develops, and markets athletic apparel, footwear, equipment, and accessories in six major categories: running, basketball, soccer, training, sportswear, and Jordan. Footwear generates about two thirds of its sales. Nike’s brands include Nike, Jordan, and Converse (casual footwear). Nike sells products worldwide and outsources its production to more than 300 factories in more than 30 countries. Nike was founded in 1964 and is based in Beaverton, Oregon

 (Source: Morningstar)

General Advice Warning

Any advice/ information provided is general in nature only and does not take into account the personal financial situation, objectives or needs of any particular person.

Categories
Technology Stocks

Raising Moderna’s FVE to $182 on Pipeline Progress and Additional 2022 COVID-19 Vaccine Sales

Business Strategy and Outlook

Moderna’s mRNA technology has gained rapid validation as sales of its COVID-19 vaccine soar in 2021, but we think the firm has yet to secure a narrow economic moat around its business, largely due

to uncertainties tied to an evolving virus and the changing competitive landscape for innovative vaccines.

In a record-breaking span of just 11 months, Moderna created, developed, manufactured, and got regulatory authorization for mRNA-1273, a two-dose COVID-19 vaccine that is one of the first two mRNA vaccines ever authorized (alongside Pfizer/BioNTech’s BNT162b2). The pandemic accelerated Moderna’s evolution into a commercial-stage biotech, and we expect that the firm’s ramp-up in manufacturing and clinical know-how will pave the way for faster timelines for additional programs. Moderna’s mRNA platform, involving rapid design and similar manufacturing across programs, allows the company to pursue multiple programs in parallel. Moderna also retains full rights to most of its programs, although key partnerships with Merck and AstraZeneca help support its efforts in oncology.

We expect the firm to report $17 billion in COVID-19 vaccine sales in 2021, with $20 billion in sales in 2022 as demand for first doses begins to decline but demand for boosters expands. We see potential for sustained revenue in the low-single-digit billions annually if higher-risk populations continue to receive annual vaccines beyond the pandemic, although there is high uncertainty around the number of long-term competitors (including new mRNA players) and pricing.

Moderna’s most advanced program outside COVID-19 is for cytomegalovirus, a leading cause of birth defects, but several other vaccines are in earlier trials, targeting other respiratory viruses like RSV and influenza. We see each of these as more than $1 billion annual sales opportunities. Moderna is also pursuing therapeutic cancer vaccines with Merck, as well as regenerative therapeutics and intratumoral immuno-oncology therapies with AstraZeneca, which we include in our valuation. We recently included Moderna’s leading secreted or intracellular protein programs in our valuation, as they have entered early-stage development.

Financial Strength

Moderna raised $1.85 billion through two equity offerings in 2020, ending the year with cash and investments of $5.25 billion. This added substantially to the firm’s IPO proceeds in 2018 of $563 million. Given Moderna’s massive expected COVID-19 vaccine sales in 2021 and lack of debt, the firm’s

financial strength looks solid.

Bulls Say’s

  • The stellar efficacy and safety profile of Moderna’s COVID-19 vaccine offered rapid validation of the firm’s mRNA technology
  • Its mRNA technology could allow the firm to compete in a wide range of therapeutic areas, ranging from other prophylactic vaccines (like influenza and other viruses) to enzyme replacement (various rare diseases) to cancer
  • Moderna’s cash infusion from COVID-19 vaccine sales in 2021, as well as newly established large-scale manufacturing facilities, positions the firm to accelerate timelines for new pipeline programs

Company Profile 

Moderna is a commercial-stage biotech that was founded in 2010 and had its initial public offering in December 2018. The firm’s mRNA technology was rapidly validated with its COVID-19 vaccine, which was authorized inthe United States in December 2020. Moderna had 24 mRNA development programs as of early 2021, with 13 of these in clinical trials. Programs span a wide range of therapeutic areas, including infectious disease, oncology, cardiovascular disease, and rare genetic diseases.

(Source: MorningStar)

General Advice Warning

Any advice/ information provided is general in nature only and does not take into account the personal financial situation, objectives or needs of any particular person.

Categories
Fixed Income Fixed Income

TCW Emerging Markets Local Currency Income Fund Class

Approach

A combination of flexibility and caution, as well as a thoughtful approach to country and currency analysis, continue to support a High Process Pillar rating. This strategy’s approach combines fundamental analysis and top-down research with an aim to manage downside risk. Analysts are responsible for setting three-, six-, and 12-month targets for local rates positions, and the team actively trades around currency positions. There is evaluation of interest rates and currencies on a country-by-country basis, and its higher-conviction positions aren’t usually more than a few percentage points off the JPMorgan GBI-Emerging Markets Global Diversified Index’s, a sensible guardrail given the exchange-rate volatility inherent here. 

In addition, it isn’t typically, complete avoid an index constituent, either taking a small position in that country’s rates or currency, which makes sense given the small number of names (roughly 20) in the sovereign bond benchmark. The strategy also allows up to 20% in U.S.-dollar-denominated debt and cash. Still, the process allows plenty of room to manoeuvre. When it’s found that emerging-markets currencies are extremely undervalued, it can take that exposure up to 125%, and when they are expensive it can hedge it to 75%. The portfolio is further diversified by off-index plays, which have included frontier markets (Egypt) and developed markets (Greece). 

Portfolio

The process allows for ample movement in the strategy’s overall emerging-markets currency exposure, which has been dialled up and down in a tactical fashion based on valuations and its market outlook. The portfolio’s overall emerging-markets currency exposure was light (around 75% of assets) following 2012’s big market runup, which served the strategy well when things got tough in 2013. The managers brought that exposure up to the 90% range at the end of the sell-off in 2015 and then let it run in the 110%-120% range as it rallied in 2016 and 2017. Since the pandemic-riled markets in February 2020, the team has kept the portfolio’s overall emerging-markets currency exposure between 93% and 100%, given it has been concerned about U.S. dollar strength. The strategy sticks close to the benchmark, but at times its high-conviction and tactical nature is on full display. In 2020, the team was overweight in longer Brazilian debt based on valuations and favorable real rates, which hurt early on during that year. But off-benchmark moves have helped combat the concentration risk associated with this bogy. The portfolio’s positioning in Egypt was a prime example in 2020: That stake sat at 5% to start the year, and the team cut it completely by the end of March to redeploy to more attractively priced opportunities before building it back to 4% at the end of September. As of September 2021, the team continued to hold a 4% stake in local Egyptian debt given its attractive yield and pending inclusion into the JPMorgan GBI-Emerging Markets Global Diversified Index.

People

This remains one of the more-experienced teams that works well together, but its size hasn’t kept pace with some larger peers. This underpins its People Pillar downgrade to Above Average from High.

Emerging-markets bond veterans Penny Foley and David Robbins took over here in December 2009. Foley cofounded an institutional emerging-markets debt and equity strategy in 1987; Robbins joined her there in 2000 after running emerging-markets trading at Lehman Brothers and Morgan Stanley. Alex Stanojevic, a trader with the team since 2005, was named comanager in mid-2017, helping build ample transition time for when Foley eventually retires. 

The managers’ supporting cast is experienced and works together well, but it’s half the size of some peers, which can leave the team stretched in an ever-expanding investment universe. The managers are supported by five sovereign analysts led by Blaise Antin, who joined TCW in 2000. Longtime team member Javier Segovia leads a group of three emerging-markets corporate analysts including Stephen Keck, who has focused on this sector for TCW since 2003, and two more experienced analysts who joined in 2011 and 2015. This corporate cast, while experienced, is much leaner than some peers. Additionally, their relative inexperience with Asian corporate credit was partly to blame for 2021’s disappointing performance. As the emerging-markets debt market grows, this midsized team will need to stick to what it knows best to maintain its edge.

Performance 

This strategy’s Institutional share class gained 0.6% annualized from its mid-December 2010 inception through December 2021, ranking third out of 14 distinct strategies in the emerging-markets local-currency bond Morningstar Category. It also outpaced the JPMorgan GBI-Emerging Markets Global Diversified Index by roughly 10 basis points annualized. Though the strategy isn’t likely to reach the heights of its more aggressive competitors in strong rallies, it’s been no slouch. It edged out its typical peer and benchmark in 2016 and 2017, for example, through smart positioning with larger index constituents such as Brazil and Russia, as well as picking out-of-benchmark winners such as the Indian rupee and Egyptian pound. The strategy has held up better than peers and the index in some tough markets thanks to the team’s valuation discipline and smart allocation moves. Taking emerging-markets currency exposure down to 75% of assets and raising cash to around 11% helped going into 2013’s taper tantrum, as did some better performing off-index investments in China and Uruguay. Still, lately there have been a few bumps in the road. The strategy’s 9.3% loss in 

2021 lagged its typical rival by 110 basis points and its benchmark by 90 basis points. Much of this underperformance owed to the team’s overweighting in emerging-markets local-currency exposure, as the U.S. dollar outperformed for most of the year. From a country perspective, an overweighting and long-duration positioning in Mexico and Columbia were painful.

(Source: Morningstar)

General Advice Warning

Any advice/ information provided is general in nature only and does not take into account the personal financial situation, objectives or needs of any particular person.

Categories
Commodities Trading Ideas & Charts

Walgreens Raises Guidance After Strong First Fiscal Quarter Results; Increasing our FVE to $48

Business Strategy and Outlook

Founded in 1901, Walgreens Boots Alliance is a leading global retail pharmacy chain. In fiscal 2020, the company generated approximately $140 billion in revenue and dispensed over a billion prescriptions annually, representing just under a quarter of the U.S. drug market. The firm’s over 9,000 domestic stores are strategically located in high-traffic areas to generate over $13 million per store, which drives scale and remains a critical consideration in an increasingly competitive market that has witnessed rationalization. The core business is centred around the pharmacy, which accounts for about three fourths of revenue and is considered the main driver of traffic.

Despite Walgreens’ scale as a leading purchaser of prescription drugs and competitive advantage over smaller retail pharmacy chains, gross margins have come under pressure in recent years as a result of pharmacy benefit managers’ negotiation leverage and market power. These pressures have affected margins across the entire retail pharmacy industry, pushing the largest players (Walgreens, CVS, Walmart) to branch into other healthcare services. Walgreens has been focused on leveraging scale to foster strategic partnerships to increase traffic and cross-selling opportunities with a long-term focus to improve coordinated care. 

While Walgreens has expanded into omnichannel offerings, we think the company’s high-traffic brick-and-mortar locations and convenience-oriented approach is less susceptible to pressures from e-commerce and mass merchandisers, particularly in the health and wellness categories, than other retailers. Historically the company’s strategy was based on footprint expansion but having established a scalable infrastructure, the focus has evolved and the concentration has shifted to improving store utilization and strategically aligning with healthcare partners to address the macro trend of localized community healthcare. The company’s partnership with VillageMD to establish primary-care clinics in

select Walgreens locations further establishes the drugstore as a one-stop shop for care.

Financial Strength

As of fiscal first-quarter 2022, cash and equivalents were over $4.1 billion, offset by $13.8 billion in debt, with $2.0 billion due over the next three years. The company continues to focus on its core assets, and the recent divestiture of its international wholesale business should allow the company to pay down debt and fund strategic initiatives to improve its long-term positioning. We believe the firm will be able to rebuild its cash balance through the normal course of business. Free cash flow generation was over $4 billion in fiscal 2020 and is expected to normalize at these levels in the near term.

Bulls Say’s

  • As a leading retail pharmacy with around 9,000domestic locations, Walgreens is able to reach 80% of U.S. consumers.
  • Strategic partnerships focused on increasing store utilization through the addition of clinical partners to localize community healthcare should be a natural extension in providing coordinated care that will increase community engagement and offset reimbursement pressures. 
  • An increase in higher-margin health and beauty merchandise sales bolsters front-end store performance

Company Profile 

Walgreens Boots Alliance is a leading retail pharmacy chain, with over 13,000 stores in 50 states and 9 countries. Walgreens’ core strategy involves brick-and-mortar retail pharmacy locations in high-traffic areas, with nearly 80% of the U.S. population living within 5 miles of a store. Currently, the company has a leading market share of the domestic prescription drug market at about 20%. In 2021, the company sold off a majority of its Alliance Healthcare wholesale business to AmerisourceBergen for $6.5 billion, doubling down on its core pharmacy efforts and ventures in strategic growth areas in primary care (VillageMD) and digital offerings. The company also has equity stakes in AmerisourceBergen (29%) and Sinopharm Holding Guoda Drugstores (40%).

(Source: MorningStar)

General Advice Warning

Any advice/ information provided is general in nature only and does not take into account the personal financial situation, objectives or needs of any particular person.

Categories
Commodities Trading Ideas & Charts

CMS plans net-zero carbon emissions by 2040

Business Strategy and Outlook

CMS Energy’s transformation during the past decade into a mostly regulated utility has set it up for a long runway of growth during the next decade. In addition, CMS’ work with Michigan regulators and politicians has turned the state into one of the most constructive areas for utility investment. These constructive relationships will be critical as CMS pursues an aggressive clean energy growth plan. 

With regulatory and political backing, CMS plans more than $13 billion of investment the next five years and potentially as much as $25 billion during the next 10 years. Its goal to reach net-zero carbon emissions by 2040 is a key part of its growth plan, supporting 6%-8% annual earnings growth for many years. 

Michigan’s 2008 energy legislation and additional reforms in the state’s 2016 Energy Law transformed the state’s utility regulation. As a result of those changes, CMS Energy has achieved a series of constructive regulatory decisions. 

CMS has secured regulatory approval for almost all its near-term capital investment as part of the state’s 10-year integrated resource plan framework. We expect regulators to support CMS’ updated 10-year plan filed in mid-2021. If CMS can keep rate increases modest by controlling operating costs, it is expected to continue to get regulatory support and could even add as much as $1 billion of investment on top of its current plan. 

CMS’ growth strategy focuses on investment in electric and gas distribution and renewable energy, which aligns with Michigan’s clean energy policies and is likely to earn regulatory support. CMS plans to retire the Palisades nuclear plant and all its coal fleet by 2025, keeping it on track to cut carbon emissions 60% by 2025 and reach net-zero carbon emissions by 2040. Proceeds from its EnerBank sale in 2021 will help finance growth investment. 

CMS carries an unusually large amount of parent debt, which has helped boost consolidated returns on equity, but investors should consider the refinancing risk if credit markets tighten.

Financial Strength

Although CMS has trimmed its balance sheet substantially, its consolidated 70% debt/capital ratio remains high primarily because of $4 billion of parent debt. Accordingly, the company’s EBITDA/interest coverage ratio is lower than peers, near 5 times. CMS has reduced its near-term financing risk with opportunistic refinancing. It is projected CMS to maintain its current level of parent debt and take advantage of lower interest rates as it refinances. This should enhance returns for shareholders. Management appears committed to maintaining the current balance sheet and improving its credit metrics through earnings growth. We expect CMS’ consolidated returns on equity to top 13% for the foreseeable future, among the best in the industry due to this extra leverage. CMS has taken advantage of favourable bond markets to extend its debt maturities, including issuing three series of 60-year notes in 2018 and 2019. CMS now has $1.1 billion of parent notes due in 2078-79 at a weighted-average interest rate near 5.8%. CMS also has been able to issue 40- and 50-year debt at the utility subsidiary. Regulators thus far have not imputed CMS’ parent debt to the utilities, but that’s a risk that ultimately could end up reducing CMS’ allowed returns, customer rates and earnings. We don’t expect the company to issue large amounts of equity after pricing a $250 million forward sale at an average $51 per share in 2019 and issuing $230 million of preferred stock in 2021 at a 4.2% yield. We expect the $930 million aftertax cash proceeds from the EnerBank sale will offset new equity needs through 2024. With constructive regulation, we expect CMS will be able to use its cash flow to fund most of its investment plan during the next five years.

Bulls Say’s

  • Regulation in Michigan has improved since landmark reforms in 2008 and 2016. Support from policymakers and regulators is critical to realizing earnings and dividend growth. 
  • CMS’ back-to-basics strategy has focused on investment in regulated businesses, leading to a healthier balance sheet and more reliable cash flow. 
  • CMS’ board has more than doubled the dividend since 2011. We expect 7% annual dividend increases going forward even if the pay out ratio remains above management’s 60% target.

Company Profile 

CMS Energy is an energy holding company with three principal businesses. Its regulated utility, Consumers Energy, provides regulated natural gas service to 1.8 million customers and electric service to 1.8 million customers in Michigan. CMS Enterprises is engaged in wholesale power generation, including contracted renewable energy. CMS sold EnerBank in October 2021.

(Source: MorningStar)

General Advice Warning

Any advice/ information provided is general in nature only and does not take into account the personal financial situation, objectives or needs of any particular person.

Categories
Commodities Trading Ideas & Charts

Magellan Is Buying Back Units More Aggressively Than Most Midstream Player

Business Strategy and Outlook

Magellan’s refined product pipelines are high-quality assets that have contributed to earnings stability as well as steady increases in distributions over time. As both supply and demand are remarkably steady over time, Magellan has been able to extract modest inflation-linked price increases. However, investment opportunities have been more limited in the refined products segment. As a result, Magellan has invested more than $5 billion largely elsewhere since 2010 and has built up a respectable but ultimately more volatile and lower-quality crude oil pipeline, which now contributes about a third of operating margin.While the competitive intensity of the new businesses is higher than the core refined product pipelines.

Magellan’s current growth capital program is expected to wind down in 2021 with only $80 million in planned expenditures given the difficult environment. In 2022, Morningstar analyst focus remains on capital allocation. Growth spending is expected to be minimal. With a newly expanded $1.5 billion unit buyback in place, the partnership has already bought back $750 million in units in 2020 and 2021. Asset sales have contributed with $271 million completed in 2021, and another $435 million awaiting regulatory approvals and expected to be completed in 2022. 

Magellan Midstream Sees Stronger Volume Recovery in 2021, Expands Buyback Program

Magellan’s capital spending program remains quite muted, as it plans to spend $80 million in 2021 and $20 million in 2022 on growth projects presently, it has devoted much more capital toward buybacks recently. The partnership bought back $391 million in units during the quarter, wrapping up its $750 million program initiated in 2020. The board has added another $750 million in buybacks and extended the program to 2024. With the stock trading below our fair value estimate, Morningstar analyst view both the historical repurchases and future program as good capital allocation and supportive of our Exemplary capital allocation rating.

Financial Strength

Magellan remains among the most prudent managers of capital in our MLP coverage. Three factors support this partnership’s exceptional level of financial health. First, the lack of general partner sponsorship keeps Magellan’s cost of equity lower than peers. Second, conservative leverage (far below its maximum ratio of 4 times debt/EBITDA) has kept its cost of debt low and provided considerable flexibility in financing growth projects. Third, ample distribution coverage has allowed management to fully fund its growth initiatives through retained distributable cash flow without needing to tap equity markets.

Magellan was one of the first MLPs to buy out its general partner interests in 2010. Better aligning interest of its holders, the deal also lowered the partnership’s cost of equity capital. Its stable, largely contracted sources of revenue and low leverage relative to peers also support among the lowest cost of debt in the industry. Combined, this cost of capital advantage and low leverage allows Magellan to more opportunistically engage in growth initiatives. Magellan has about $1 billion in liquidity compared and no debt maturities until 2025. The firm has flexed capital spending as needed to address any financial issues.

Bulls Say

  • Magellan has been highly discerning with regards to capital allocation and invested in a number of attractive projects at excellent prices. 
  • Magellan supplies more than 40% of the refined products to 7 of the 15 states it serves. 
  • Magellan only undertakes profitable butane blending opportunities when spreads warrant it, meaning this is a low-risk endeavour.

Company Profile

While Magellan’s capital spending program remains quite muted, as it plans to spend $80 million in 2021 and $20 million in 2022 on growth projects presently, it has devoted much more capital toward buybacks recently. The partnership bought back $391 million in units during the quarter, wrapping up its $750 million program initiated in 2020. The board has added another $750 million in buybacks and extended the program to 2024. With the stock trading below our fair value estimate, we view both the historical repurchases and future program as good capital allocation and supportive of our Exemplary capital allocation rating.

(Source: Morningstar)

General Advice Warning

Any advice/ information provided is general in nature only and does not take into account the personal financial situation, objectives or needs of any particular person.