Categories
Fixed Income Fixed Income

PIMCO ESG Global Bond Fund: A Fund providing exposure to core bond holding with ESG bias

The Fund provides exposure to investment grade securities from around the globe while incorporating PIMCO’s ESG screening framework. The strategy can be used as a core bond holding in client portfolios who have an ESG bias. The PIMCO Global Bond Fund is in attraction due to the well-resourced / experienced investment team and PIMCO’s well established investment process. PIMCO’s ESG framework involves three stages: (1) Exclude (restrictions on certain sectors). (2) Evaluate (best in class ESG issuers + prime engagement candidates). (3) Engage (engage issuers to improve ESG related business practices).

Downside Risk

  • Interest rate risk (bond prices and yields are inversely related). 
  • Credit risk (the risk of downgrades or even default) & inflation risk. 
  •  Personnel risk – significant turnover among the 3 lead PMs.

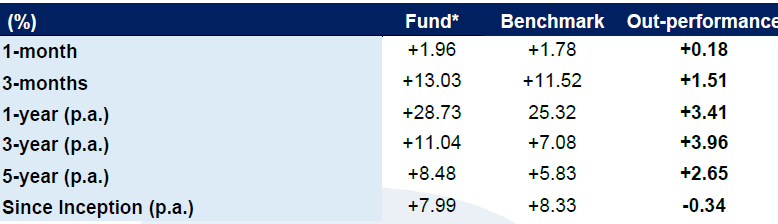
Fund Performance (As at Aug, 2021)

C:\Users\Akhila\Downloads\Screenshot 2021-12-29 144804.png

Investment Process

PIMCO applies a wide range of strategies including Duration analysis, Credit analysis, Relative Value analysis, Sector Allocation and Rotation and individual security selection. The Manger looks to make active decisions with a long-term focus and avoid extreme swings in duration or maturity with a view to creating a steady stream of returns. The Manager has designed and structured a global investment process that includes both top-down and bottom-up decision-making. The first and most important step in the firm’s process is to get the long-term view correct. The figure below provides a summary of the key elements in the investment process.

C:\Users\Akhila\Downloads\Screenshot 2021-12-29 145011.png

Secular analysis: The Manager considers its secular analysis as critical to the investment process, with the firm devoting three days every year to a “Secular Forum”. At this forum, the firm formulates PIMCO’s outlook for global bond markets over the next three to five years. Selected members of the investment staff are assigned secular topics to monitor, including monetary and fiscal policy, inflation, demographics, technology, productivity trends, and global trade. Secular researchers tackle their subjects on a global basis and approach them over a multi-year horizon. At the forum the researchers present their findings to all of the firm’s investment professionals. 

Decision making: Post Secular and Economic Forums, the Investment Committee (senior portfolio managers) develop major strategies that serve as a model for all portfolios using a consensus-based approach. The IC utilises top-down analysis provided by the forums as well as bottom-up input from specialists who focus on various fixed income sectors and the regional portfolio committees. The Investment Committee sets targets for portfolio characteristics such as duration, yield curve exposure, convexity, sector concentration and credit quality and ensures themes are consistently applied across all portfolios. The portfolio management group including the PIMCO Global Strategy team, through the incorporation of the Investment Committee’s model portfolio characteristics, will then construct the Fund.

About the fund

 The ESG Global Bond Fund is an actively managed portfolio of global fixed interest investment which incorporates PIMCO’s ESG screening. The portfolio predominantly invests in governments, corporate, mortgage and other global fixed interest securities.

(Source: Banyantree)

General Advice Warning

Any advice/ information provided is general in nature only and does not take into account the personal financial situation, objectives or needs of any particular person.

Categories
Funds Funds

UBS Property Securities Fund: The fund which aims to outperform the S&P/ASX 300 Property Accumulation Index

Investment strategy 

The Fund uses a multi-step investment process for constructing the Fund’s investment portfolio that combines top-down sector allocation with bottom-up individual stock selection. Top-down sector allocation is determined through a systematic evaluation of listed and direct property market trends and conditions. Bottom-up stock selection is driven by proprietary analytical techniques to conduct fundamental company analysis, which provides a framework for security selection through an analysis of individual securities independently and relative to each other. Investment return objective The Fund aims to outperform (after management costs) the S&P/ASX 300 Property Accumulation Index over rolling three year periods.

Investment return objective 

The Fund aims to outperform (after management costs) the S&P/ASX 300 Property Accumulation Index over rolling three year periods.

 Downside Risks

  • Deterioration in the Australian economy especially the property market (fundamentals deteriorate). Rising bond yields negatively impacting pricing. 
  • The Portfolio Manager/analysts miss-calculate their bottom-up valuation 
  • Key person risks in Mr. Pica (however, the CBRE investment team is relatively large and capable of succession planning). 

Fund Performance (as at 31 May 2021)

C:\Users\Akhila\Downloads\Screenshot 2021-12-23 163325.png

(Source: UBS)

Fund Positioning: Top 5 Holdings – Overweights & Underweights (as at 31 May 2021)

C:\Users\Akhila\Downloads\Screenshot 2021-12-23 164000.png

(Source: UBS)

Investment Process

The Fund uses an investment process that combines in-depth top-down and bottom- up fundamental market research with a disciplined and systematic approach to portfolio construction and risk management. The Portfolio Manager’s bottom-up approach integrates both quantitative and qualitative research to identify individual securities where the real estate is undervalued and represents the most compelling investment opportunities. The securities research process incorporates several factors including: 

  • Property visits – the Portfolio Manager utilises its local presence to gauge the quality and location of the real estate, assessing properties and capital expenditure needs at the property level. 
  • Management meetings – the Portfolio Manager assesses the management team’s alignment with shareholders; determines the depth and experience of the team; and judges their ability to articulate and execute their strategy. 
  •  Modelling – the Portfolio Manager generates cash flow earnings projections; performs net asset value analysis; and analyses the capital structure. 

About the fund

The UBS Property Securities Fund (portfolio managed by CBRE while Distributed by UBS) is a portfolio of mainly Australian Real Estate Investment Trusts that the investment team believes are being undervalued by the market, based on the in-house assessment of the company’s future cashflows. The Fund aims to outperform (after management costs) the S&P/ASX 300 Property Accumulation Index over rolling five-year periods 

(Source: Banyantree)

General Advice Warning

Any advice/ information provided is general in nature only and does not take into account the personal financial situation, objectives or needs of any particular person.

Categories
Dividend Stocks

General Mills’ Strong Brands Provide the Pricing Power Needed to Combat Inflationary Pressures

Business Strategy and Outlook

As at-home food consumption remains elevated during the pandemic, consumers are finding favor with General Mills’ offerings, as shown by increases in household penetration and repeat purchase rates in most categories. It is expected that this lift will largely be temporary, with consumers gradually returning to activities outside of the home, returning away-from-home food expenditures to half, as it was prior to the pandemic. But it is also expected that a lasting benefit for General Mills’ pet food business exist, given the high-single-digit increase in pet adoptions during the crisis.

General Mills has earned a narrow moat rating for its preferred status with retailers, strong brand equities, and cost edge. Due to evolving nutritional preferences, consumers have been shifting from processed fare to fresh, natural options, causing General Mills’ categories to slow. In response, the firm laid out its Accelerate strategy in 2021, which calls for the company to overhaul its marketing and innovation processes. Specifically, the firm will shift media investments to digital formats to better align with consumer media consumption, it will launch bolder innovations with a faster speed to market, it will be a force for good-with purpose-driven brands–and it will invest in data analytics (leveraging proprietary data from its Box Tops program and brand websites) to drive growth. Further, the firm will reshape its portfolio by divesting 5% of sales that dilute growth and will acquire growing businesses that strengthen its five global platforms (cereal, pet, ice cream, snack bars, Mexican) or its positioning in its eight core markets (U.S., Canada, France, U.K., Australia, China, Brazil, and India).

Financial Strength 

General Mills has generally maintained a net debt/adjusted EBITDA ratio of under 3 times, although the fiscal 2018 acquisition of Blue Buffalo increased the metric to 4.8 times. But in fiscal 2021, the firm reduced leverage to below 3 times, returning the firm to its pre-acquisition capital allocation priorities of 1) capital expenditures, 2) dividend growth, 3) strategic acquisitions, and 4) share repurchases. In September 2020, General Mills implemented its first dividend hike since the tie-up, in the spring of 2021 it resumed share repurchases, and in July it closed on its $1.2 billion acquisition of no-moat Tyson’s pet snacks business. General Mills generates a significant amount of free cash flow (cash flow from operations less capital expense), averaging 15% of sales over the past three years, generally in line with our 14% annual average over the next five years. 

Bulls Say 

  • General Mills’ pet food business should benefit from the high-single-digit increase in pet adoptions during the pandemic. Its BLUE brand has been growing rapidly, as on-trend innovations are resonating with consumers.
  • The firm is modernizing its brand-building capabilities, with shortened lead times for new product launches and advertising budgets that are shifting to digital formats where consumers are spending more time. 
  • General Mills’ well-developed Strategic Revenue Management and Holistic Margin Management programs should help the firm offset steep cost inflation.

Company Profile

General Mills is a leading global packaged food company that produces snacks, cereal, convenient meals, yogurt, dough, baking mixes and ingredients, pet food, and superpremium ice cream. Its largest brands are Nature Valley, Cheerios, Old El Paso, Yoplait, Pillsbury, Betty Crocker, BLUE, and Haagen-Dazs. In fiscal 2021, 75% of its revenue was derived from the United States, although the company also operates in Canada, Europe, Australia, Asia, and Latin America. While most of General Mills’ products are sold through retail stores to consumers, the company also sells products into the food-service channel and the commercial banking industry

 (Source: Morningstar)

General Advice Warning

Any advice/ information provided is general in nature only and does not take into account the personal financial situation, objectives or needs of any particular person.

Categories
Financial Markets Sectors Technology Technology Stocks

Alphabet Inc. earnings momentum to continue driven by Cloud Business and focus on AI and Machine Learning

Investment Thesis:

  • Commands a strong market position in online advertising and online eyeballs. 
  • Search advertising increasing its share of advertising spend. 
  • Leveraged to online video steaming and advertising via YouTube. 
  • Strong balance sheet with over US$130bn in cash, which gives flexibility to invest in growth options or undertake capital management initiatives. 
  • Focus on innovation across advertising businesses, which should help to sustain growth. 
  • Strong management team. 
  • Value accretive acquisitions in existing and new growth areas. 
  • Recent disclosure suggests GOOGL’s Cloud business building good revenue momentum.

Key Risks:

  • Threat of increased regulatory scrutiny, including concerns around consumer privacy and personal data.
  • Regulatory changes which impacts the way GOOGL does business (e.g. forced changes to products). 
  • Expenses such as TAC (traffic acquisition costs) increase ahead of expectations and which the company is unable to pass onto customers. 
  • Deterioration in economic conditions, which would put pressure on the advertising revenue. 
  • Competition from companies like Facebook Inc., Amazon etc. could put pressure on margins. 
  • Potential return from investment on new, innovative technology fails to yield adequate results.

Key highlights:

  • GOOGL reported a very strong quarter, with revenues of $61.9bn up +61.6% (or up +57% in constant currency).
  • Total Google Services revenues of $57.1bn was up +63%, with Google Search & Other up +68.1% (led by strong growth in retail), YouTube ads up +83.7% (driven by brand and direct response) and Google advertising up +60.4% (driven by Ad Manager and AdMob)
  • Google Cloud revenue was up +53.9% to $4.6bn, driven by growth in infrastructure and platform services. GOOGL’s total cost of revenues of $26.2bn was up +41%, driven by growth in TAC (traffic acquisition costs), which was up +63% to $10.9bn. Group operating income was up +203.3% to $19.4bn (with margin expanding to 31.3% from 16.7% in pcp), driven predominantly by Google Services (up +134.2% to $22.3bn).
  • GOOGL continues to spit out significant amount of cash from operations, reporting free cash flow of $16.4bn in 2Q21 and $58.5bn over the trailing 12 months.
  • At the end of the quarter, the balance sheet had $136bn cash (& equivalent). The Board has amended the existing $50bn stock repurchase program to permit the repurchase of both Class A and Class C shares.

Company Description: 

Alphabet Inc is headquartered in Mountain View, California, and provides online advertising services across the globe. It offers performance and brand advertising services through Google and Other Bets segments. The Google segment offers products, such as Ads, Android, Chrome, Google Cloud, Google Maps, Google Play, Hardware, Search, and YouTube, as well as technical infrastructure. This segment also offers digital content, cloud services, hardware devices, and other miscellaneous products and services. The Other Bets segment includes businesses, including Access, Calico, CapitalG, GV, Verily, Waymo, and X, as well as Internet and television services.

(Source: Banyantree)

General Advice Warning

Any advice/ information provided is general in nature only and does not take into account the personal financial situation, objectives or needs of any particular person.

Categories
Technology Stocks

Adobe’s ARR Slip-Up and Light Guidance for 2022 Leave Shares Attractive; FVE Up to $630

Business Strategy and Outlook

Adobe has come to dominate in content creation software with its iconic Photoshop and Illustrator solutions, both now part of the broader Creative Cloud, which is now offered via a subscription model. The company has added new products and features to the suite through organic development and bolt-on acquisitions to drive the most comprehensive portfolio of tools used in print, digital, and video content creation The benefits from software as a service are well known in that it offers significantly improved revenue visibility and the elimination of piracy for the company, and a much lower cost hurdle to overcome and a solution that is regularly updated with new features for users.

Adobe benefits from the natural cross-selling opportunity from Creative Cloud to the business and operational aspects of marketing and advertising. It is expected that Adobe will continue to focus its M&A efforts on the digital experience segment and other emerging areas. Adobe believes it is attacking an addressable market greater than $205 billion. The company is introducing and leveraging features across its various cloud offerings (like Sensei artificial intelligence) to drive a more cohesive experience, win new clients, upsell users to higher price point solutions, and cross sell digital media offerings.

Adobe’s ARR Slip-Up and Light Guidance for 2022 Leave Shares Attractive; FVE Up to $630

Adobe reported mixed fourth-quarter results, including revenue upside, messy billings, modest EPS upside, and light guidance. However, Morningstar analyst believe the outlook is better than it appears. After all, the 2022 outlook is just 1% below FactSet consensus, with pressure driven by having one less week than 2021 and foreign exchange combining to add a 300 basis point headwind to growth. After factoring guidance and results along with rolling with DCF forward,  analyst of Morningstar have raised fair value estimate to $630 per share from $610. 

Financial Strength 

Adobe enjoys a position of excellent financial strength arising from its strong balance sheet, growing revenues, and high and expanding margins. As of November 2021, Adobe has $5.8 billion in cash and equivalents, offset by $4.1 billion in debt, resulting in a net cash position of $1.6 billion. Adobe has historically generated strong operating margins. Free cash flow generation was $6.9 billion in fiscal 2021, representing a free cash flow margin of 43.7%.Morningstar analyst believes that margins should continue to grind higher over time as the digital experience segment scales. In terms of capital deployment, Adobe reinvests for growth, repurchases shares, and makes acquisitions. The company does not pay a dividend. Over the last three years Adobe has spent $2.8 billion on acquisitions, $9.6 billion on buy-backs, while share count has decreased by 15 million shares. Morningstar analyst believes that the company will continue to repurchase shares as its primary means of returning cash to shareholders over the medium term and will continue to make opportunistic and strategic tuck-in acquisitions.

Bulls Say 

  • Adobe is the de facto standard in content creation software and PDF file editing, categories the company created and still dominates. 
  • Shift to subscriptions eliminates piracy and makes revenue recurring, while removing the high up-front price for customers. Growth has accelerated and margins are expanding from the initial conversion inflection. 
  • Adobe is extending its empire in the creative world from content creation to marketing services more broadly through the expansion of its digital experience segment. This segment should drive growth in the coming years.

Company Profile

Adobe provides content creation, document management, and digital marketing and advertising software and services to creative professionals and marketers for creating, managing, delivering, measuring, optimizing and engaging with compelling content multiple operating systems, devices and media. The company operates with three segments: digital media content creation, digital experience for marketing solutions, and publishing for legacy products (less than 5% of revenue).

 (Source: Morningstar)

General Advice Warning

Any advice/ information provided is general in nature only and does not take into account the personal financial situation, objectives or needs of any particular person.

Categories
LICs LICs

Plato Income Maximiser Limited raises $139.5m

Plato Income is Financial Industry with sub- industry is Asset Management. Market Capitalization is 657.126m. Their 5 years Monthly Beta is 0.78. 

Plato Income’s NTA values shows below are before the dividend of $0.005 per share payable on 31 December 2021. The ex-date of the dividend is 16th December 2021. 

Plato Income Maximiser limited Pre – Tax NTA $1.101 while Post – tax NTA is 1.105. Per – tax NTA Includes tax on realised gains/losses and other earnings but excludes any provision from tax on unrealised gains/losses. Post – Tax NTA includes tax on realised and unrealised gains/losses and other earnings. 

During November, PL8 raised $139.5m in total through a Placement to wholesale investors and a Share Purchase Plan (SPP). The Placement to wholesale investors raised $71.3m with the issue of 64.3m fully paid ordinary shares at $1.11 per share. 

The SPP raised $68.2m through the issue of 62m new shares at $1.10 per share. The SPP was oversubscribed with the Company targeting $50m, however the Company decided not to scale back any applications.

The proceeds from the Placement and the SPP will be invested via the Plato Australian Shares Income Fund in accordance with the Company’s structure and investment strategy.

PL8 took the opportunity to raise capital when the Company was trading at a premium. The share price closed at $1.285 on 2 November, the day prior to the capital raising announcement, an 11.7% premium to the pre-tax NTA and a 15% premium to the post-tax NTA. 

The issue of new shares through the Placement and SPP has seen the share price decline to be trading closer to the pre-tax NTA at November-end.

Portfolio Performance as at 30th November 2021

PORTFOLIO PERFORMANCE¹1M%3M%1YR% P.A.3YRS% P.A.INCEPTION% P.A.
Total return²-0.7-2.114.813.59.6
Income³0.61.66.08.37.4
Bench. total return²-0.4-2.017.014.010.1
Excess total return²-0.3-0.1-2.2-0.5-0.5
Excess Income³0.0-0.11.13.42.2
Excess franking³0.00.00.51.20.9

Company Profile 

Plato Income Maximiser Limited is a listed investment company incorporated in Australia. The Company has been established to provide investors with the opportunity to benefit from an investment in an actively managed, well-diversified portfolio of Australian listed equities by investing in an the unlisted scheme Plato Australian Shares Income Fund.

(Source: BanyanTree)

General Advice Warning

Any advice/ information provided is general in nature only and does not take into account the personal financial situation, objectives or needs of any particular person.

Categories
Dividend Stocks Sectors

Bendigo & Adelaide comprising 4.5cps Y20 final dividend and 23.5cps FY21 interim dividend

Investment Thesis

  • Relative to major banks, BEN trades at fair value in our view, on 13.2x one-year forward price to earnings, 0.9x price to book and dividend yield of ~5.0%. 
  • Strong franchise model with funding predominately by way of deposits. 
  • Expected low levels of impairment charges (especially as a low interest rate environment helps customers and arrears). 
  • Continued strong cost discipline, improving efficiency and boosting performance. 
  • Advanced accreditation in progress (which may improve ROE). 
  • Potential pressure on net interest margins as competition intensifies, with major banks in a low interest rate environment. 
  • Leading in terms of customer satisfaction and net promoter metrics, which are increasingly key in a period where trust is paramount.

Key Risks

  • Intense competition for loan growth, combined with further discounting. 
  • Volatility in Homesafe earnings. 
  • Increase in bad and doubtful debts or increase in provisioning. It is to monitor the asset quality of Rural Bank and Great Southern portfolios. 
  • Funding pressure for deposits and wholesale funding.

FY21 Results Highlights

  • Statutory net profit of $243.9m, up +67.3%. Cash earnings after tax of $219.7m, up 1.9%. Cash earnings per share of 41.4cps declined -5.5%. Total income was $849.0m, up +3.3%. Operating expenses of $517.4m, down -3.1% as BEN was able to drive cost reductions across the business. 
  • Net interest margin of 2.30% was down 7bps, reflecting “active pricing and volume management for lending and deposits, despite lower lending rates due to a mix of growth and competitive new business rates”. Core BEN NIM of 1.97% was up +6bps on 2H20 NIM of 1.93%. Management noted the December 2020 exit NIM was -3bps lower, which again highlights margin pressure remains from front book/back book repricing. However, we expect this to be offset by favourable funding costs. 
  • Bad and doubtful debts of $19.5m, declined – 15.9%, and comprises 6bps of gross loans. This was a solid outcome and we are likely to continue to see lower BDDs in the near-term. However, we remain cautious of this trend further out as government assistance starts to pull back. 
  • Common Equity Tier 1 of 9.36%, improved 36 basis points on the pcp, above APRA’s ‘unquestionably strong’ benchmark.

Company Profile 

Bendigo and Adelaide Bank Ltd (BEN) offers a variety of banking and other financial services including internet banking, housing finance, retail and business banking, commercial finance, funds management, treasury and foreign exchange services, superannuation and trustee services.

(Source: BanyanTree)

General Advice Warning

Any advice/ information provided is general in nature only and does not take into account the personal financial situation, objectives or needs of any particular person.

Categories
Dividend Stocks Sectors

Spark New Zealand reports earnings better than expected; however it was negatively impacted by Covid

Investment Thesis:

  • Attractive dividend yield of 5.4%. 
  • Market-leading position in New Zealand. Dominant market share in Mobile, Broadband and is the leader in IT Services. 
  • Strong capacity for growth demonstrated across all segments, with IT expected to continue to be a key driver as more consumers and businesses migrate to the Cloud. 
  • Investments in Broadband and the roll-out of 4.5G should see its lagging broadband segment improve.
  • Multi-product offerings provide interesting points of differentiation from other telco providers. 
  • Implementation of “Agile” leading to further cost reductions and operating efficiencies. 
  • Increasing customer demand for higher-margin cloud-based services. 
  • Increases in ARPU growth and connections despite weak industry conditions 
  • SPK still commands a strong market positions and has the ability to invest in technologies and areas which could provide room for growth.

Key Risks:

  • Unsuccessful migration of copper wire customers resulting in earnings drag in May due to weather conditions. 
  • More competition in its Mobile and Broadband segments leading to aggressive margin contraction, especially as products become commoditized. 
  • Risk of cost blowout (for instance in network upgrades or maintenance). 
  • Churn risk. 
  • Balance sheet risk (including credit ratings risk) should earnings decline due competitive and structural risks. 
  • Reduced flexibility and increased net debt if unable to fund total dividend by earnings per share 
  • Any network disruptions/outages.

Key highlights:

  • SPK’s earnings were negatively impacted by Covid-19 with ongoing loss of mobile roaming revenues and lower growth broadband and prepaid markets.
  • EBITDA was up +0.4% to $502m, despite Covid-19 impacts, offset from strong cost controls.
  • Margin of 27.4% was 60bps lower than the pcp. NPAT was -11.4% lower to $148m, driven by a $29m increase in depreciation and amortisation charges resulting from the shorter asset lives of new digital technologies, and higher depreciation related to customer and property leases.
  • Operating expenses declined $30m, or -2.3%, offsetting revenue declines
  • NPAT was -11.4% lower to $148m, driven by a $29m increase in depreciation and amortisation charges resulting from the shorter asset lives of new digital technologies, and higher depreciation related to customer and property leases.
  • Free cash flow of $113m, was up $63m over the pcp on tight management of working capital resulting in higher cash conversion rate of 102%.

Company Description: 

Spark New Zealand Ltd (SPK) is a New Zealand based telecommunications company. SPK’s key services are the provision of telephone lines, mobile telecommunications, broadband services and IT services. Its key product offerings are Spark Home, Mobile & Business, Spark Digital, Spark Ventures, and Spark Connect. The Company operates four main segments: (1) Spark Home, Mobile & Business; (2) Spark Digital; (3) Spark Connect & Platforms; and (4) Spark Ventures & Wholesale.

(Source: Banyantree)

General Advice Warning

Any advice/ information provided is general in nature only and does not take into account the personal financial situation, objectives or needs of any particular person.

Categories
Funds Funds Research Sectors

WCM Focused International Growth Fund Institutional Class: A promising option

Approach

The managers first generate ideas through a quality-growth screen, which includes companies with market caps of at least $3.5 billion, a good liquidity profile, and other metrics such as strong and improving margins. The team excludes non-growth industries such as utilities and looks for companies with solid returns on invested capital. Factors such as economies of scale, intellectual property, and legal or regulatory advantages are key. The team also places a heavy emphasis on culture, believing that culture drives certain companies forward and helps maintain their competitive edge. The team takes its best ideas and builds a relatively concentrated portfolio of roughly 30 to 40 international stocks. Because of their benchmark-agnostic approach, the portfolio may have extreme over- and underweighting to various sectors.

Portfolio

The managers use their best ideas to build a concentrated portfolio. . Coming out of the 2007-09 global financial crisis, the managers felt like their portfolio was too concentrated at about 20 holdings. They’ve gradually increased that count, and in July 2021 had 35 holdings. While still relatively concentrated (the typical foreign large-growth peer held 83 stocks in July), the expansion helps reduce individual stock risk. The managers take other prudent steps to minimize risk and remain relatively diverse. They avoid sectors that they believe offer little growth potential and as of July 2021, the fund had no exposure to energy, real estate, or utilities.

Portfolio Holdings .png

People

Co-CEO and manager Kurt Winrich’s upcoming retirement has been long in the works and the team will still have four capable managers to pick up the slack. Mike Trigg, who has been on the strategy since the fund’s 2011 inception, is the final decision-maker here. . Peter Hunkel, who has also managed since the fund’s inception, is responsible for portfolio construction. The team promoted Sanjay Ayer, also a former Morningstar equity analyst, to the management ranks in June 2019. Ayer joined WCM in 2007 and manages the WCM Global Growth Fund WCMGX and the WCM Emerging Markets Fund WCMEX, which have had success under him. Paul Black, co-CEO of WCM, is a named manager here but serves mainly as an advisor to the team. 

Performance 

Strong stock selection has fueled the fund’s outperformance. Picks in technology and industrials, in particular, have been among the biggest contributors to its performance. That helped the strategy weather 2020’s first-quarter coronavirus-driven slide. The fund held up slightly better than the index losing 29.4% from Jan. 18 to March 23, 2020, compared with the index’s 30.3% loss. The managers then opportunistically added MercadoLibre MELI and Ferrari RACE, which benefitted the strategy coming out of the bear market. In 2021, the fund has returned to its winning ways. Its 12.7% return handily beat the index’s 4.6% and the Morningstar Category’s 4.5%. That was good for the top decile in the category. Holdings such as ASML Holdings NV ADR ASML and Shopify SHOP were among the leading contributors in that period.

Performance .png

About the Fund

WCM Focused International Growth Fund seeks long term capital appreciation by investing in equity securities of non-U.S. domiciled companies or depository receipts of non-U.S. domiciled companies.

(Source: Morningstar)

General Advice Warning

Any advice/ information provided is general in nature only and does not take into account the personal financial situation, objectives or needs of any particular person.

Categories
Financial Markets Sectors Technology Technology Stocks

Equinix reports strong results driven by increased gross bookings in key American regions

Investment Thesis:

  • In our view, considering the quality of the business, EQIX is trading at fair valuation (from the perspective of trading multiples, dividend yield and our DCF valuation). 
  • Attractive long-term outlook in global digitization and data requirements of companies, with 5G and cloud computing as key drivers. 
  • Businesses moving away from on-premise centres towards colocation and cloud networks. 
  • Diversified client base and revenue stream minimises contractual risk. 
  • Opportunity for future market share expansion via potential acquisitions.

Key Risks:

  • Increases to operating expenses – particularly electricity costs. However, the contracts between Equinix and its customers provide for rights and protection clauses to permit the Company to pass on electricity cost increases that exceed 5%. 
  • Rising technology and acceptance of cloud-based services may incentivise businesses to fully leverage cloud infrastructure rather than connecting with IBX data centres. However, management has downplayed these concerns, stating that there must still be direct interconnection between Cloud and businesses within the data centres. 
  • Newer IBX data centres have twice the cooling needs as old centres. Potential power limitations could force the company to have a lower utilization rate of its cabinets.  
  • Increased competition in the industry from the likes of Google, Apple, Microsoft and Digital Reality Trust, and the possibility of formation of strong strategic alliances amongst competitors 
  • EQIX is subject to exchange rate risk due to the company’s diverse geographical scale of operations. However, the company hedges many of these exposures. 
  • REIT classification mandates a minimum of 90% of taxable income paid to shareholders. This may hinder EQIX’s ability to increase its cash via retained earnings and could render the company’s balance sheet inflexible.

Key highlights:

  • Over the quarter, revenues up +8% to $1.7bn, adjusted EBITDA up +7% and AFFO was ahead of management’s expectations.
  • Strong quarterly result, with revenues up +8% to $1.7bn, adjusted EBITDA up +7% and AFFO growth of +10% (normalised and constant currency) was ahead of management’s expectations.
  • Interconnection revenues grew +12%
  • On a normalized and constant currency basis, Americas’ revenue growth of +8% YoY was among the highest in as many quarters. Adjusted EBITDA of $326m was up +3%.
  • Asia-Pacific reported normalized and constant currency revenue up +11% YoY and normalised MRR up +9% YoY, with management noted MRR growth was partially impacted by Covid related constraints in Singapore and political uncertainty in Hong Kong.
  • Total gross debt at the end of the quarter was $11.8bn, with weight average borrowing costs of 1.72% (95% of the debt is at fixed rate) and weight average maturity of debt 9.6 years. 
  • Net leverage ratio at the end of the period was 3.8x

Company Description: 

Equinix (NASDAQ: EQIX) is a leading company in internet connection and data centres. It is the global market leader in colocation data centre industry, providing data services and platforms for over 9800 companies across 24 countries. This allows companies to connect to their online ecosystem and meet their interconnection needs for their business operations. EQIX also offers additional solutions such as the Equinix Cloud Exchange Fabric to connect data centres to cloud networks, and the recently introduced Equinix SmartKey to offer encryption protection for the data security management of companies.

(Source: Banyantree)

General Advice Warning

Any advice/ information provided is general in nature only and does not take into account the personal financial situation, objectives or needs of any particular person.